Immigrants from Burma/Myanmar vs Irish GED/Equivalency
COMPARE
Immigrants from Burma/Myanmar
Irish
GED/Equivalency
GED/Equivalency Comparison
Immigrants from Burma/Myanmar
Irish
83.0%
GED/EQUIVALENCY
0.2/ 100
METRIC RATING
268th/ 347
METRIC RANK
87.6%
GED/EQUIVALENCY
98.6/ 100
METRIC RATING
78th/ 347
METRIC RANK
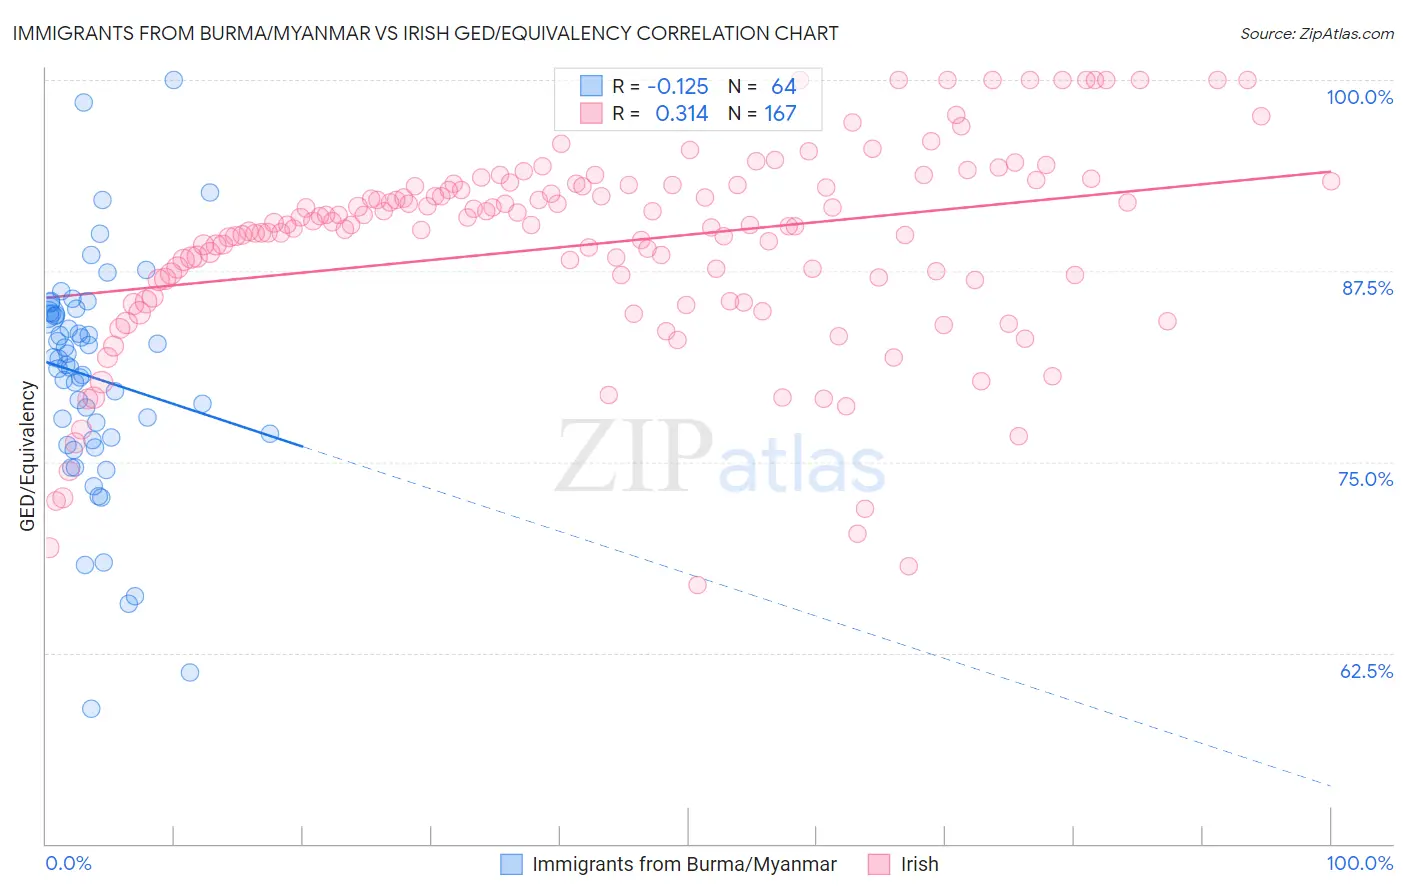
Immigrants from Burma/Myanmar vs Irish GED/Equivalency Correlation Chart
The statistical analysis conducted on geographies consisting of 172,357,706 people shows a poor negative correlation between the proportion of Immigrants from Burma/Myanmar and percentage of population with at least ged/equivalency education in the United States with a correlation coefficient (R) of -0.125 and weighted average of 83.0%. Similarly, the statistical analysis conducted on geographies consisting of 580,709,357 people shows a mild positive correlation between the proportion of Irish and percentage of population with at least ged/equivalency education in the United States with a correlation coefficient (R) of 0.314 and weighted average of 87.6%, a difference of 5.6%.
GED/Equivalency Correlation Summary
| Measurement | Immigrants from Burma/Myanmar | Irish |
| Minimum | 58.8% | 67.0% |
| Maximum | 100.0% | 100.0% |
| Range | 41.2% | 33.0% |
| Mean | 80.5% | 89.2% |
| Median | 81.5% | 90.5% |
| Interquartile 25% (IQ1) | 76.5% | 86.9% |
| Interquartile 75% (IQ3) | 84.7% | 93.1% |
| Interquartile Range (IQR) | 8.1% | 6.2% |
| Standard Deviation (Sample) | 7.5% | 6.6% |
| Standard Deviation (Population) | 7.4% | 6.6% |
Similar Demographics by GED/Equivalency
Demographics Similar to Immigrants from Burma/Myanmar by GED/Equivalency
In terms of ged/equivalency, the demographic groups most similar to Immigrants from Burma/Myanmar are Trinidadian and Tobagonian (83.0%, a difference of 0.040%), Hopi (83.0%, a difference of 0.040%), West Indian (83.1%, a difference of 0.060%), Kiowa (83.1%, a difference of 0.060%), and Bangladeshi (83.1%, a difference of 0.070%).
| Demographics | Rating | Rank | GED/Equivalency |
| Inupiat | 0.2 /100 | #261 | Tragic 83.1% |
| Immigrants | Armenia | 0.2 /100 | #262 | Tragic 83.1% |
| Immigrants | Congo | 0.2 /100 | #263 | Tragic 83.1% |
| Bangladeshis | 0.2 /100 | #264 | Tragic 83.1% |
| West Indians | 0.2 /100 | #265 | Tragic 83.1% |
| Kiowa | 0.2 /100 | #266 | Tragic 83.1% |
| Trinidadians and Tobagonians | 0.2 /100 | #267 | Tragic 83.0% |
| Immigrants | Burma/Myanmar | 0.2 /100 | #268 | Tragic 83.0% |
| Hopi | 0.2 /100 | #269 | Tragic 83.0% |
| Immigrants | Jamaica | 0.2 /100 | #270 | Tragic 82.9% |
| U.S. Virgin Islanders | 0.2 /100 | #271 | Tragic 82.9% |
| Barbadians | 0.1 /100 | #272 | Tragic 82.9% |
| Pennsylvania Germans | 0.1 /100 | #273 | Tragic 82.9% |
| Immigrants | Trinidad and Tobago | 0.1 /100 | #274 | Tragic 82.8% |
| Seminole | 0.1 /100 | #275 | Tragic 82.8% |
Demographics Similar to Irish by GED/Equivalency
In terms of ged/equivalency, the demographic groups most similar to Irish are Slavic (87.7%, a difference of 0.020%), Immigrants from Serbia (87.7%, a difference of 0.030%), English (87.6%, a difference of 0.030%), Scottish (87.7%, a difference of 0.040%), and Immigrants from Kuwait (87.7%, a difference of 0.060%).
| Demographics | Rating | Rank | GED/Equivalency |
| Austrians | 98.8 /100 | #71 | Exceptional 87.7% |
| Immigrants | Moldova | 98.8 /100 | #72 | Exceptional 87.7% |
| Belgians | 98.8 /100 | #73 | Exceptional 87.7% |
| Immigrants | Kuwait | 98.8 /100 | #74 | Exceptional 87.7% |
| Scottish | 98.7 /100 | #75 | Exceptional 87.7% |
| Immigrants | Serbia | 98.7 /100 | #76 | Exceptional 87.7% |
| Slavs | 98.7 /100 | #77 | Exceptional 87.7% |
| Irish | 98.6 /100 | #78 | Exceptional 87.6% |
| English | 98.6 /100 | #79 | Exceptional 87.6% |
| Immigrants | England | 98.5 /100 | #80 | Exceptional 87.6% |
| Immigrants | Sri Lanka | 98.3 /100 | #81 | Exceptional 87.5% |
| Romanians | 98.3 /100 | #82 | Exceptional 87.5% |
| South Africans | 98.3 /100 | #83 | Exceptional 87.5% |
| Immigrants | Romania | 98.1 /100 | #84 | Exceptional 87.5% |
| Dutch | 98.1 /100 | #85 | Exceptional 87.5% |