Immigrants from Burma/Myanmar vs Immigrants from Czechoslovakia GED/Equivalency
COMPARE
Immigrants from Burma/Myanmar
Immigrants from Czechoslovakia
GED/Equivalency
GED/Equivalency Comparison
Immigrants from Burma/Myanmar
Immigrants from Czechoslovakia
83.0%
GED/EQUIVALENCY
0.2/ 100
METRIC RATING
268th/ 347
METRIC RANK
87.9%
GED/EQUIVALENCY
99.3/ 100
METRIC RATING
57th/ 347
METRIC RANK
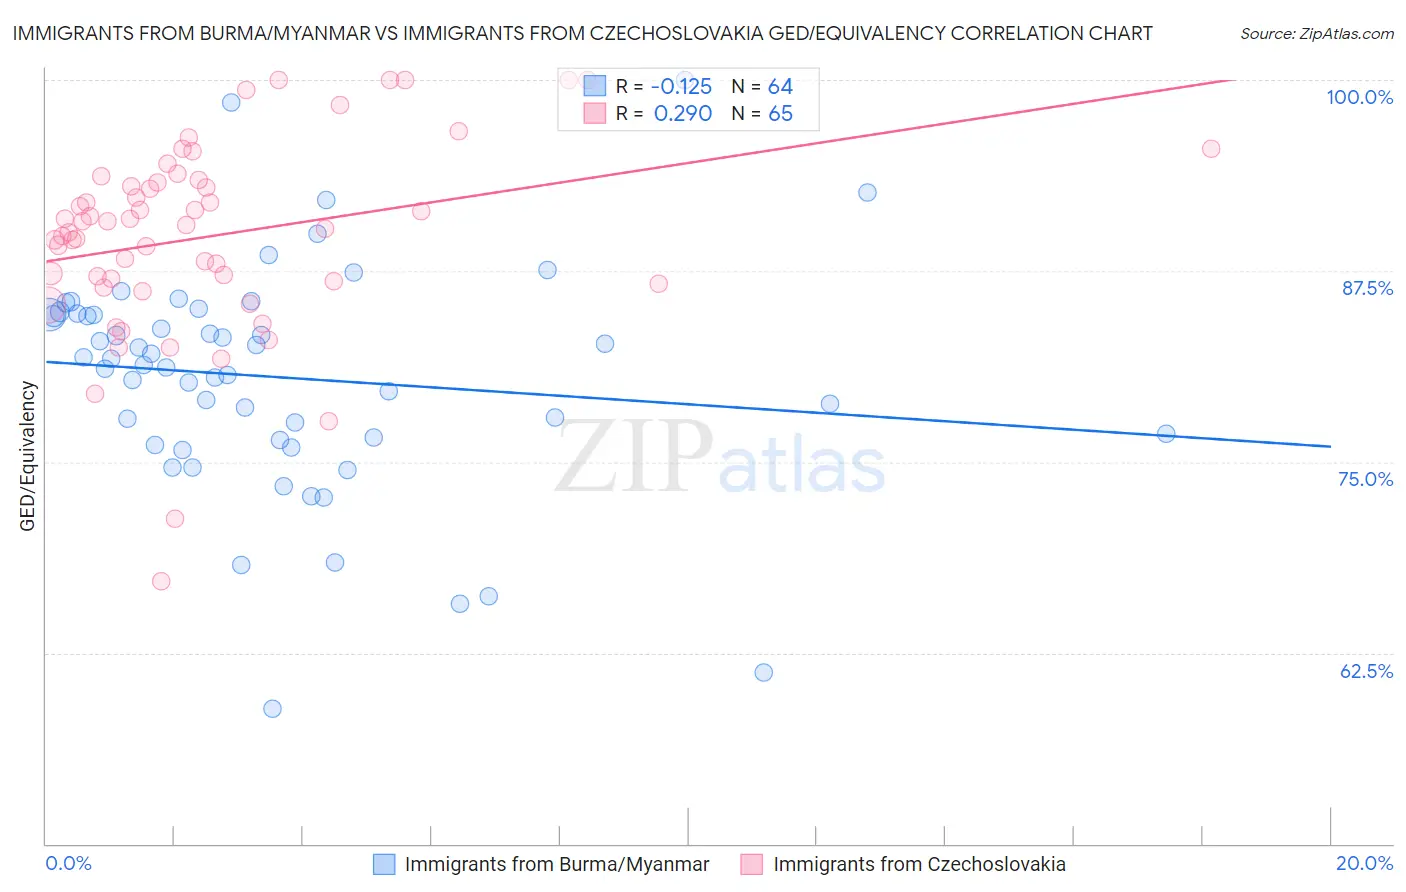
Immigrants from Burma/Myanmar vs Immigrants from Czechoslovakia GED/Equivalency Correlation Chart
The statistical analysis conducted on geographies consisting of 172,357,706 people shows a poor negative correlation between the proportion of Immigrants from Burma/Myanmar and percentage of population with at least ged/equivalency education in the United States with a correlation coefficient (R) of -0.125 and weighted average of 83.0%. Similarly, the statistical analysis conducted on geographies consisting of 195,448,106 people shows a weak positive correlation between the proportion of Immigrants from Czechoslovakia and percentage of population with at least ged/equivalency education in the United States with a correlation coefficient (R) of 0.290 and weighted average of 87.9%, a difference of 5.9%.
GED/Equivalency Correlation Summary
| Measurement | Immigrants from Burma/Myanmar | Immigrants from Czechoslovakia |
| Minimum | 58.8% | 67.2% |
| Maximum | 100.0% | 100.0% |
| Range | 41.2% | 32.8% |
| Mean | 80.5% | 89.8% |
| Median | 81.5% | 90.5% |
| Interquartile 25% (IQ1) | 76.5% | 86.7% |
| Interquartile 75% (IQ3) | 84.7% | 93.4% |
| Interquartile Range (IQR) | 8.1% | 6.6% |
| Standard Deviation (Sample) | 7.5% | 6.3% |
| Standard Deviation (Population) | 7.4% | 6.3% |
Similar Demographics by GED/Equivalency
Demographics Similar to Immigrants from Burma/Myanmar by GED/Equivalency
In terms of ged/equivalency, the demographic groups most similar to Immigrants from Burma/Myanmar are Trinidadian and Tobagonian (83.0%, a difference of 0.040%), Hopi (83.0%, a difference of 0.040%), West Indian (83.1%, a difference of 0.060%), Kiowa (83.1%, a difference of 0.060%), and Bangladeshi (83.1%, a difference of 0.070%).
| Demographics | Rating | Rank | GED/Equivalency |
| Inupiat | 0.2 /100 | #261 | Tragic 83.1% |
| Immigrants | Armenia | 0.2 /100 | #262 | Tragic 83.1% |
| Immigrants | Congo | 0.2 /100 | #263 | Tragic 83.1% |
| Bangladeshis | 0.2 /100 | #264 | Tragic 83.1% |
| West Indians | 0.2 /100 | #265 | Tragic 83.1% |
| Kiowa | 0.2 /100 | #266 | Tragic 83.1% |
| Trinidadians and Tobagonians | 0.2 /100 | #267 | Tragic 83.0% |
| Immigrants | Burma/Myanmar | 0.2 /100 | #268 | Tragic 83.0% |
| Hopi | 0.2 /100 | #269 | Tragic 83.0% |
| Immigrants | Jamaica | 0.2 /100 | #270 | Tragic 82.9% |
| U.S. Virgin Islanders | 0.2 /100 | #271 | Tragic 82.9% |
| Barbadians | 0.1 /100 | #272 | Tragic 82.9% |
| Pennsylvania Germans | 0.1 /100 | #273 | Tragic 82.9% |
| Immigrants | Trinidad and Tobago | 0.1 /100 | #274 | Tragic 82.8% |
| Seminole | 0.1 /100 | #275 | Tragic 82.8% |
Demographics Similar to Immigrants from Czechoslovakia by GED/Equivalency
In terms of ged/equivalency, the demographic groups most similar to Immigrants from Czechoslovakia are Northern European (87.9%, a difference of 0.0%), Serbian (87.9%, a difference of 0.010%), Scandinavian (87.9%, a difference of 0.020%), European (87.9%, a difference of 0.020%), and German (87.9%, a difference of 0.040%).
| Demographics | Rating | Rank | GED/Equivalency |
| Immigrants | Korea | 99.5 /100 | #50 | Exceptional 88.1% |
| Immigrants | Netherlands | 99.4 /100 | #51 | Exceptional 88.0% |
| Zimbabweans | 99.4 /100 | #52 | Exceptional 88.0% |
| Immigrants | South Africa | 99.4 /100 | #53 | Exceptional 88.0% |
| Soviet Union | 99.4 /100 | #54 | Exceptional 88.0% |
| New Zealanders | 99.4 /100 | #55 | Exceptional 88.0% |
| Immigrants | Denmark | 99.4 /100 | #56 | Exceptional 88.0% |
| Immigrants | Czechoslovakia | 99.3 /100 | #57 | Exceptional 87.9% |
| Northern Europeans | 99.3 /100 | #58 | Exceptional 87.9% |
| Serbians | 99.3 /100 | #59 | Exceptional 87.9% |
| Scandinavians | 99.3 /100 | #60 | Exceptional 87.9% |
| Europeans | 99.3 /100 | #61 | Exceptional 87.9% |
| Germans | 99.3 /100 | #62 | Exceptional 87.9% |
| Immigrants | Turkey | 99.2 /100 | #63 | Exceptional 87.9% |
| Immigrants | Canada | 99.2 /100 | #64 | Exceptional 87.9% |