Immigrants from Burma/Myanmar vs Immigrants from Somalia 9th Grade
COMPARE
Immigrants from Burma/Myanmar
Immigrants from Somalia
9th Grade
9th Grade Comparison
Immigrants from Burma/Myanmar
Immigrants from Somalia
93.1%
9TH GRADE
0.0/ 100
METRIC RATING
295th/ 347
METRIC RANK
94.1%
9TH GRADE
1.4/ 100
METRIC RATING
248th/ 347
METRIC RANK
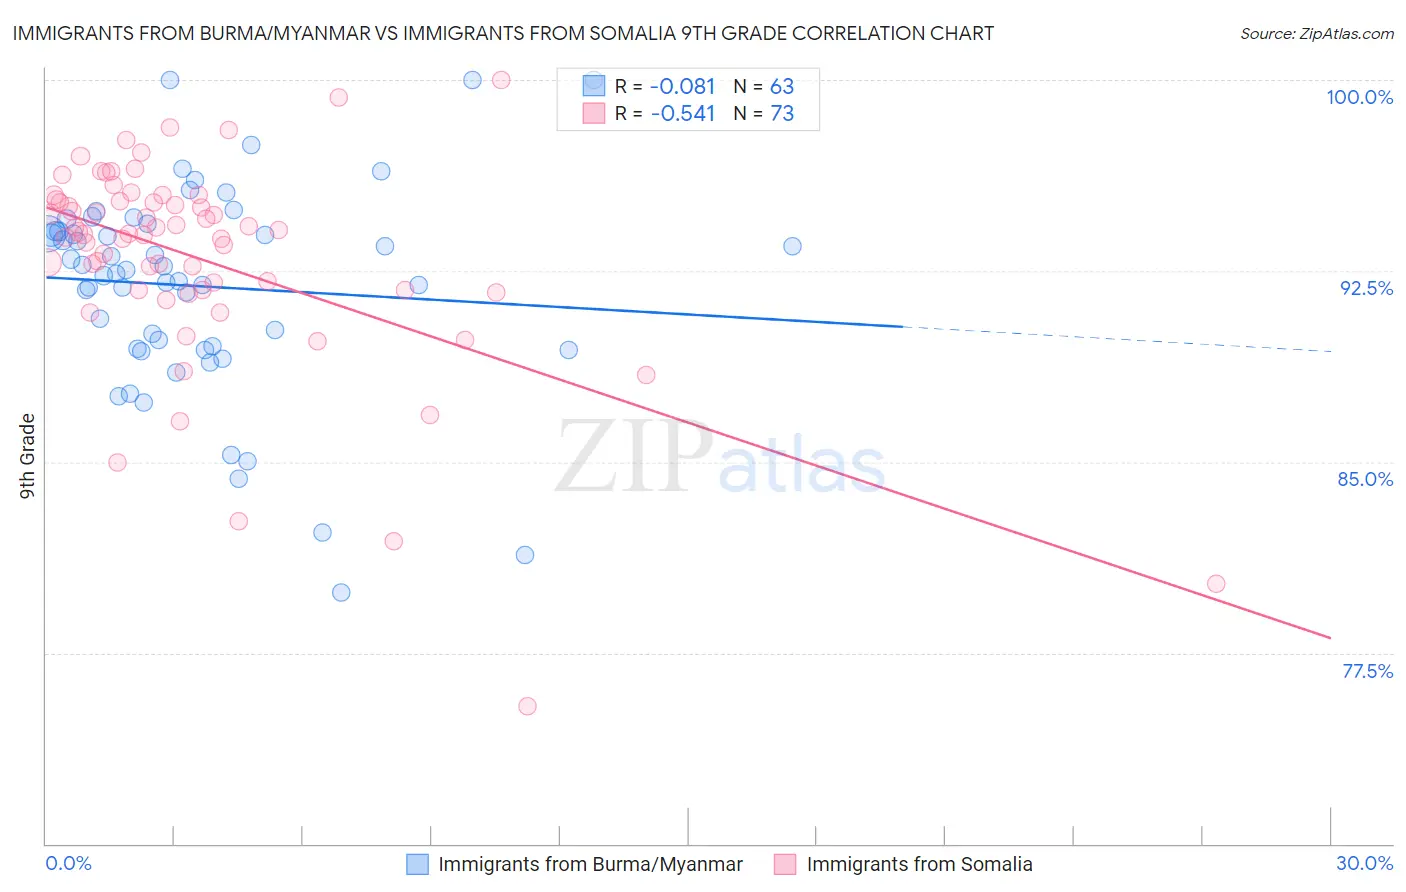
Immigrants from Burma/Myanmar vs Immigrants from Somalia 9th Grade Correlation Chart
The statistical analysis conducted on geographies consisting of 172,345,696 people shows a slight negative correlation between the proportion of Immigrants from Burma/Myanmar and percentage of population with at least 9th grade education in the United States with a correlation coefficient (R) of -0.081 and weighted average of 93.1%. Similarly, the statistical analysis conducted on geographies consisting of 92,097,499 people shows a substantial negative correlation between the proportion of Immigrants from Somalia and percentage of population with at least 9th grade education in the United States with a correlation coefficient (R) of -0.541 and weighted average of 94.1%, a difference of 1.1%.
9th Grade Correlation Summary
| Measurement | Immigrants from Burma/Myanmar | Immigrants from Somalia |
| Minimum | 79.9% | 75.4% |
| Maximum | 100.0% | 100.0% |
| Range | 20.1% | 24.6% |
| Mean | 91.9% | 93.0% |
| Median | 92.5% | 94.0% |
| Interquartile 25% (IQ1) | 89.4% | 91.7% |
| Interquartile 75% (IQ3) | 94.1% | 95.3% |
| Interquartile Range (IQR) | 4.6% | 3.5% |
| Standard Deviation (Sample) | 4.1% | 4.2% |
| Standard Deviation (Population) | 4.1% | 4.2% |
Similar Demographics by 9th Grade
Demographics Similar to Immigrants from Burma/Myanmar by 9th Grade
In terms of 9th grade, the demographic groups most similar to Immigrants from Burma/Myanmar are Indonesian (93.1%, a difference of 0.0%), Sri Lankan (93.2%, a difference of 0.020%), Cuban (93.2%, a difference of 0.020%), Fijian (93.1%, a difference of 0.030%), and Immigrants from Laos (93.2%, a difference of 0.040%).
| Demographics | Rating | Rank | 9th Grade |
| Immigrants | South Eastern Asia | 0.0 /100 | #288 | Tragic 93.3% |
| Immigrants | West Indies | 0.0 /100 | #289 | Tragic 93.3% |
| Pennsylvania Germans | 0.0 /100 | #290 | Tragic 93.3% |
| British West Indians | 0.0 /100 | #291 | Tragic 93.2% |
| Immigrants | Laos | 0.0 /100 | #292 | Tragic 93.2% |
| Sri Lankans | 0.0 /100 | #293 | Tragic 93.2% |
| Cubans | 0.0 /100 | #294 | Tragic 93.2% |
| Immigrants | Burma/Myanmar | 0.0 /100 | #295 | Tragic 93.1% |
| Indonesians | 0.0 /100 | #296 | Tragic 93.1% |
| Fijians | 0.0 /100 | #297 | Tragic 93.1% |
| Haitians | 0.0 /100 | #298 | Tragic 93.1% |
| Immigrants | Grenada | 0.0 /100 | #299 | Tragic 93.0% |
| Yaqui | 0.0 /100 | #300 | Tragic 92.9% |
| Immigrants | Haiti | 0.0 /100 | #301 | Tragic 92.7% |
| Immigrants | Dominica | 0.0 /100 | #302 | Tragic 92.7% |
Demographics Similar to Immigrants from Somalia by 9th Grade
In terms of 9th grade, the demographic groups most similar to Immigrants from Somalia are Uruguayan (94.1%, a difference of 0.010%), Immigrants from Hong Kong (94.1%, a difference of 0.010%), Senegalese (94.2%, a difference of 0.050%), Afghan (94.2%, a difference of 0.050%), and Paiute (94.2%, a difference of 0.060%).
| Demographics | Rating | Rank | 9th Grade |
| Spanish Americans | 2.6 /100 | #241 | Tragic 94.2% |
| Immigrants | Middle Africa | 2.2 /100 | #242 | Tragic 94.2% |
| Immigrants | Cameroon | 2.1 /100 | #243 | Tragic 94.2% |
| Dutch West Indians | 2.0 /100 | #244 | Tragic 94.2% |
| Paiute | 1.9 /100 | #245 | Tragic 94.2% |
| Senegalese | 1.9 /100 | #246 | Tragic 94.2% |
| Afghans | 1.8 /100 | #247 | Tragic 94.2% |
| Immigrants | Somalia | 1.4 /100 | #248 | Tragic 94.1% |
| Uruguayans | 1.3 /100 | #249 | Tragic 94.1% |
| Immigrants | Hong Kong | 1.3 /100 | #250 | Tragic 94.1% |
| Jamaicans | 1.0 /100 | #251 | Tragic 94.1% |
| Immigrants | Senegal | 0.9 /100 | #252 | Tragic 94.1% |
| Colombians | 0.8 /100 | #253 | Tragic 94.0% |
| U.S. Virgin Islanders | 0.7 /100 | #254 | Tragic 94.0% |
| Immigrants | Nigeria | 0.6 /100 | #255 | Tragic 94.0% |