Immigrants from Burma/Myanmar vs Immigrants from Korea 9th Grade
COMPARE
Immigrants from Burma/Myanmar
Immigrants from Korea
9th Grade
9th Grade Comparison
Immigrants from Burma/Myanmar
Immigrants from Korea
93.1%
9TH GRADE
0.0/ 100
METRIC RATING
295th/ 347
METRIC RANK
95.1%
9TH GRADE
79.6/ 100
METRIC RATING
149th/ 347
METRIC RANK
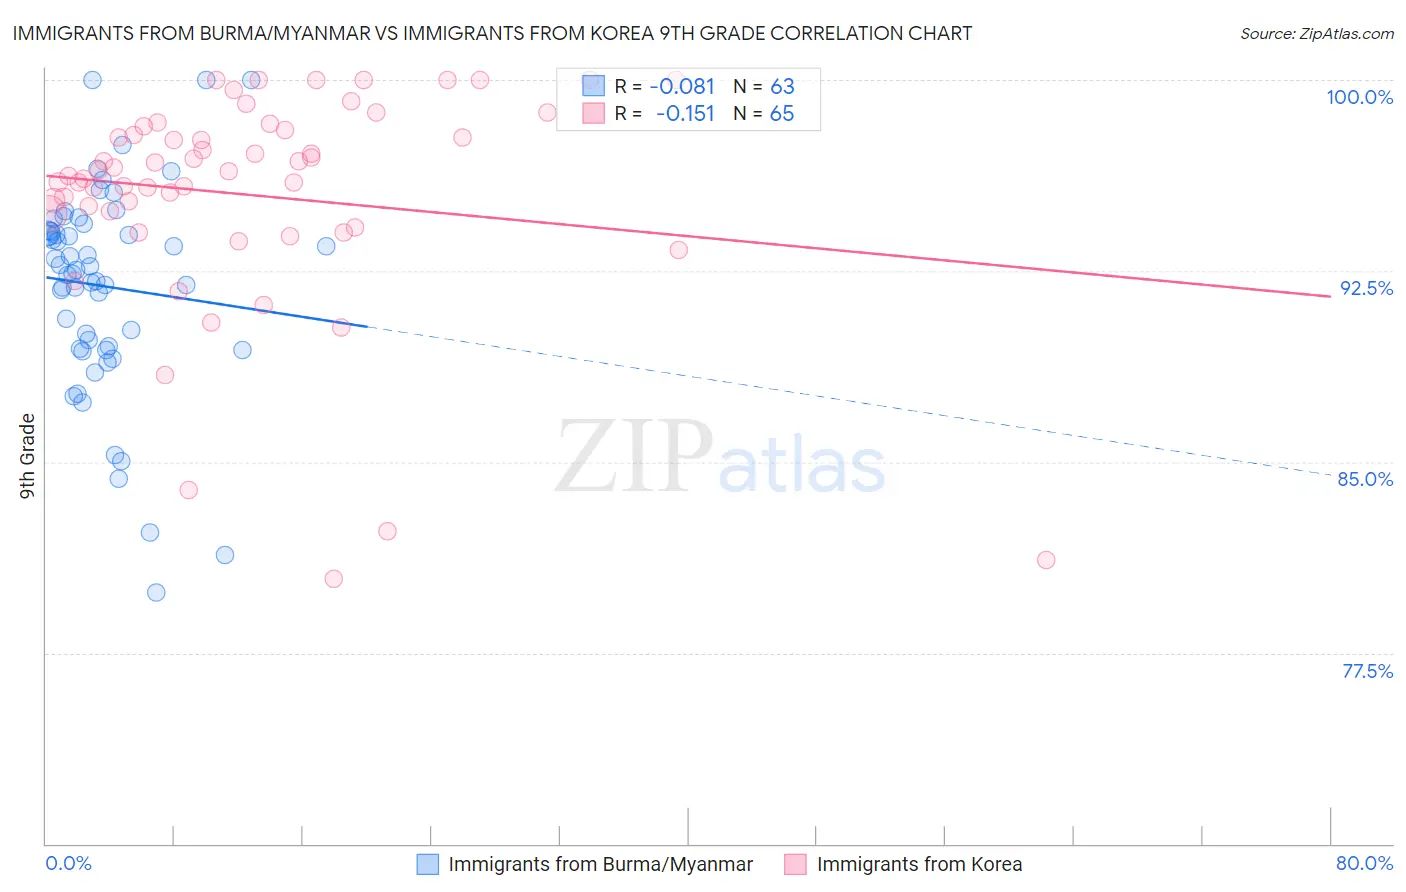
Immigrants from Burma/Myanmar vs Immigrants from Korea 9th Grade Correlation Chart
The statistical analysis conducted on geographies consisting of 172,345,696 people shows a slight negative correlation between the proportion of Immigrants from Burma/Myanmar and percentage of population with at least 9th grade education in the United States with a correlation coefficient (R) of -0.081 and weighted average of 93.1%. Similarly, the statistical analysis conducted on geographies consisting of 416,280,217 people shows a poor negative correlation between the proportion of Immigrants from Korea and percentage of population with at least 9th grade education in the United States with a correlation coefficient (R) of -0.151 and weighted average of 95.1%, a difference of 2.1%.
9th Grade Correlation Summary
| Measurement | Immigrants from Burma/Myanmar | Immigrants from Korea |
| Minimum | 79.9% | 80.4% |
| Maximum | 100.0% | 100.0% |
| Range | 20.1% | 19.6% |
| Mean | 91.9% | 95.5% |
| Median | 92.5% | 96.4% |
| Interquartile 25% (IQ1) | 89.4% | 94.5% |
| Interquartile 75% (IQ3) | 94.1% | 98.1% |
| Interquartile Range (IQR) | 4.6% | 3.6% |
| Standard Deviation (Sample) | 4.1% | 4.4% |
| Standard Deviation (Population) | 4.1% | 4.3% |
Similar Demographics by 9th Grade
Demographics Similar to Immigrants from Burma/Myanmar by 9th Grade
In terms of 9th grade, the demographic groups most similar to Immigrants from Burma/Myanmar are Indonesian (93.1%, a difference of 0.0%), Sri Lankan (93.2%, a difference of 0.020%), Cuban (93.2%, a difference of 0.020%), Fijian (93.1%, a difference of 0.030%), and Immigrants from Laos (93.2%, a difference of 0.040%).
| Demographics | Rating | Rank | 9th Grade |
| Immigrants | South Eastern Asia | 0.0 /100 | #288 | Tragic 93.3% |
| Immigrants | West Indies | 0.0 /100 | #289 | Tragic 93.3% |
| Pennsylvania Germans | 0.0 /100 | #290 | Tragic 93.3% |
| British West Indians | 0.0 /100 | #291 | Tragic 93.2% |
| Immigrants | Laos | 0.0 /100 | #292 | Tragic 93.2% |
| Sri Lankans | 0.0 /100 | #293 | Tragic 93.2% |
| Cubans | 0.0 /100 | #294 | Tragic 93.2% |
| Immigrants | Burma/Myanmar | 0.0 /100 | #295 | Tragic 93.1% |
| Indonesians | 0.0 /100 | #296 | Tragic 93.1% |
| Fijians | 0.0 /100 | #297 | Tragic 93.1% |
| Haitians | 0.0 /100 | #298 | Tragic 93.1% |
| Immigrants | Grenada | 0.0 /100 | #299 | Tragic 93.0% |
| Yaqui | 0.0 /100 | #300 | Tragic 92.9% |
| Immigrants | Haiti | 0.0 /100 | #301 | Tragic 92.7% |
| Immigrants | Dominica | 0.0 /100 | #302 | Tragic 92.7% |
Demographics Similar to Immigrants from Korea by 9th Grade
In terms of 9th grade, the demographic groups most similar to Immigrants from Korea are Kenyan (95.1%, a difference of 0.010%), Immigrants from Jordan (95.1%, a difference of 0.020%), Cajun (95.1%, a difference of 0.020%), Pueblo (95.1%, a difference of 0.030%), and Immigrants from Sri Lanka (95.1%, a difference of 0.030%).
| Demographics | Rating | Rank | 9th Grade |
| Immigrants | Greece | 84.6 /100 | #142 | Excellent 95.2% |
| Spanish | 84.4 /100 | #143 | Excellent 95.2% |
| Yup'ik | 83.3 /100 | #144 | Excellent 95.2% |
| Pueblo | 82.2 /100 | #145 | Excellent 95.1% |
| Immigrants | Sri Lanka | 82.1 /100 | #146 | Excellent 95.1% |
| Choctaw | 81.9 /100 | #147 | Excellent 95.1% |
| Immigrants | Jordan | 81.2 /100 | #148 | Excellent 95.1% |
| Immigrants | Korea | 79.6 /100 | #149 | Good 95.1% |
| Kenyans | 79.1 /100 | #150 | Good 95.1% |
| Cajuns | 77.3 /100 | #151 | Good 95.1% |
| Ugandans | 77.0 /100 | #152 | Good 95.1% |
| Albanians | 76.1 /100 | #153 | Good 95.1% |
| Arabs | 74.9 /100 | #154 | Good 95.1% |
| Immigrants | Kazakhstan | 74.7 /100 | #155 | Good 95.1% |
| Immigrants | Kenya | 73.1 /100 | #156 | Good 95.0% |