Immigrants from Southern Europe vs Immigrants from Somalia 9th Grade
COMPARE
Immigrants from Southern Europe
Immigrants from Somalia
9th Grade
9th Grade Comparison
Immigrants from Southern Europe
Immigrants from Somalia
94.3%
9TH GRADE
4.5/ 100
METRIC RATING
229th/ 347
METRIC RANK
94.1%
9TH GRADE
1.4/ 100
METRIC RATING
248th/ 347
METRIC RANK
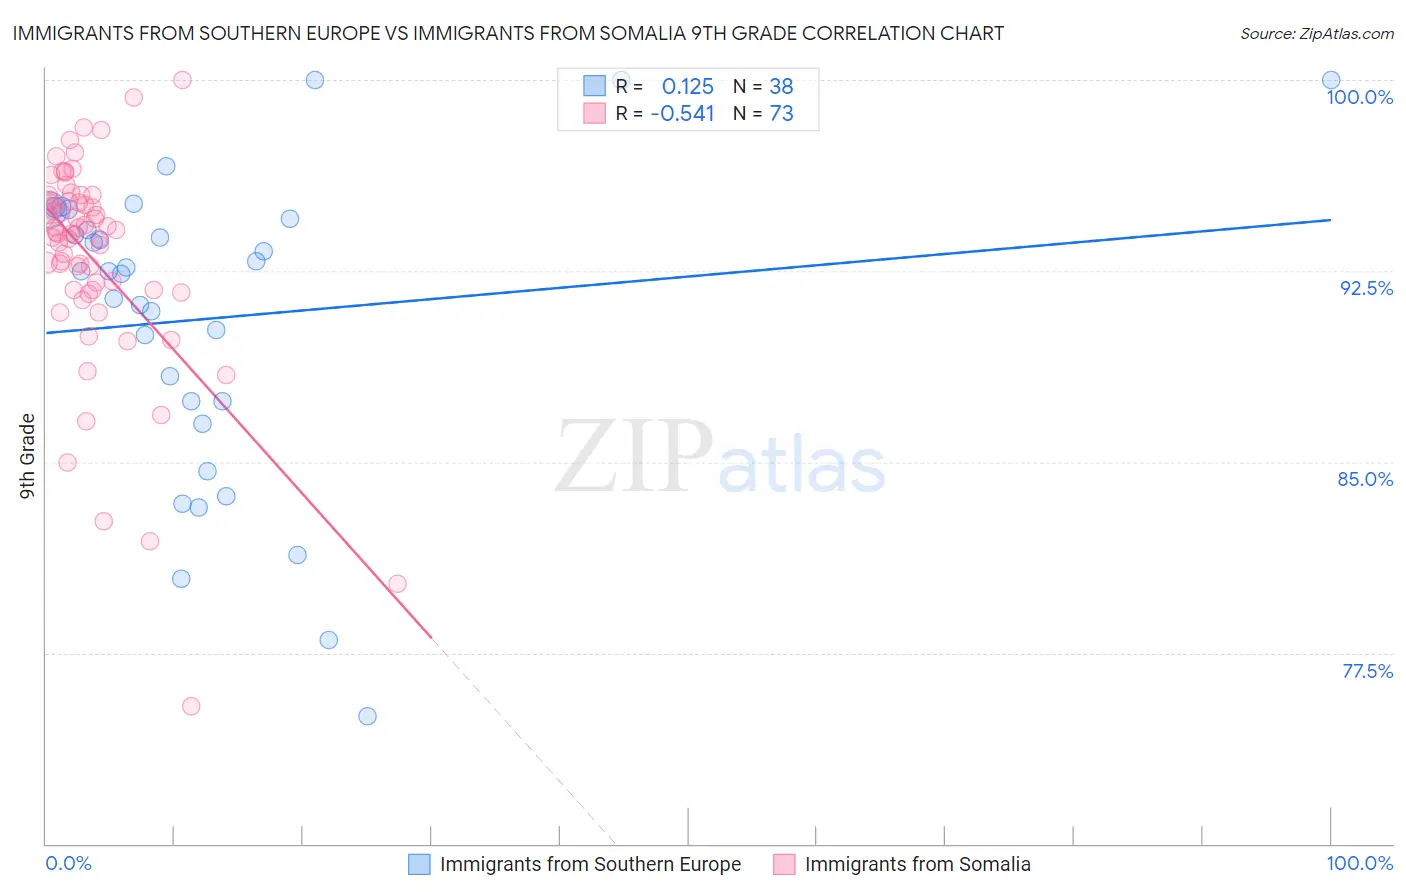
Immigrants from Southern Europe vs Immigrants from Somalia 9th Grade Correlation Chart
The statistical analysis conducted on geographies consisting of 402,804,595 people shows a poor positive correlation between the proportion of Immigrants from Southern Europe and percentage of population with at least 9th grade education in the United States with a correlation coefficient (R) of 0.125 and weighted average of 94.3%. Similarly, the statistical analysis conducted on geographies consisting of 92,097,499 people shows a substantial negative correlation between the proportion of Immigrants from Somalia and percentage of population with at least 9th grade education in the United States with a correlation coefficient (R) of -0.541 and weighted average of 94.1%, a difference of 0.22%.
9th Grade Correlation Summary
| Measurement | Immigrants from Southern Europe | Immigrants from Somalia |
| Minimum | 75.0% | 75.4% |
| Maximum | 100.0% | 100.0% |
| Range | 25.0% | 24.6% |
| Mean | 90.6% | 93.0% |
| Median | 92.5% | 94.0% |
| Interquartile 25% (IQ1) | 87.4% | 91.7% |
| Interquartile 75% (IQ3) | 94.6% | 95.3% |
| Interquartile Range (IQR) | 7.2% | 3.5% |
| Standard Deviation (Sample) | 6.0% | 4.2% |
| Standard Deviation (Population) | 5.9% | 4.2% |
Demographics Similar to Immigrants from Southern Europe and Immigrants from Somalia by 9th Grade
In terms of 9th grade, the demographic groups most similar to Immigrants from Southern Europe are Lumbee (94.4%, a difference of 0.010%), Apache (94.3%, a difference of 0.020%), Immigrants from Panama (94.3%, a difference of 0.020%), Immigrants from Africa (94.3%, a difference of 0.030%), and Nigerian (94.3%, a difference of 0.040%). Similarly, the demographic groups most similar to Immigrants from Somalia are Senegalese (94.2%, a difference of 0.050%), Afghan (94.2%, a difference of 0.050%), Paiute (94.2%, a difference of 0.060%), Dutch West Indian (94.2%, a difference of 0.070%), and Immigrants from Middle Africa (94.2%, a difference of 0.080%).
| Demographics | Rating | Rank | 9th Grade |
| Lumbee | 4.7 /100 | #228 | Tragic 94.4% |
| Immigrants | Southern Europe | 4.5 /100 | #229 | Tragic 94.3% |
| Apache | 4.2 /100 | #230 | Tragic 94.3% |
| Immigrants | Panama | 4.0 /100 | #231 | Tragic 94.3% |
| Immigrants | Africa | 3.9 /100 | #232 | Tragic 94.3% |
| Nigerians | 3.7 /100 | #233 | Tragic 94.3% |
| Costa Ricans | 3.5 /100 | #234 | Tragic 94.3% |
| Bolivians | 3.3 /100 | #235 | Tragic 94.3% |
| Somalis | 2.9 /100 | #236 | Tragic 94.3% |
| Koreans | 2.9 /100 | #237 | Tragic 94.3% |
| South American Indians | 2.8 /100 | #238 | Tragic 94.3% |
| Immigrants | China | 2.8 /100 | #239 | Tragic 94.3% |
| Immigrants | Ethiopia | 2.7 /100 | #240 | Tragic 94.3% |
| Spanish Americans | 2.6 /100 | #241 | Tragic 94.2% |
| Immigrants | Middle Africa | 2.2 /100 | #242 | Tragic 94.2% |
| Immigrants | Cameroon | 2.1 /100 | #243 | Tragic 94.2% |
| Dutch West Indians | 2.0 /100 | #244 | Tragic 94.2% |
| Paiute | 1.9 /100 | #245 | Tragic 94.2% |
| Senegalese | 1.9 /100 | #246 | Tragic 94.2% |
| Afghans | 1.8 /100 | #247 | Tragic 94.2% |
| Immigrants | Somalia | 1.4 /100 | #248 | Tragic 94.1% |