Immigrants from Burma/Myanmar vs Immigrants from Somalia 5th Grade
COMPARE
Immigrants from Burma/Myanmar
Immigrants from Somalia
5th Grade
5th Grade Comparison
Immigrants from Burma/Myanmar
Immigrants from Somalia
96.1%
5TH GRADE
0.0/ 100
METRIC RATING
304th/ 347
METRIC RANK
96.4%
5TH GRADE
0.0/ 100
METRIC RATING
295th/ 347
METRIC RANK
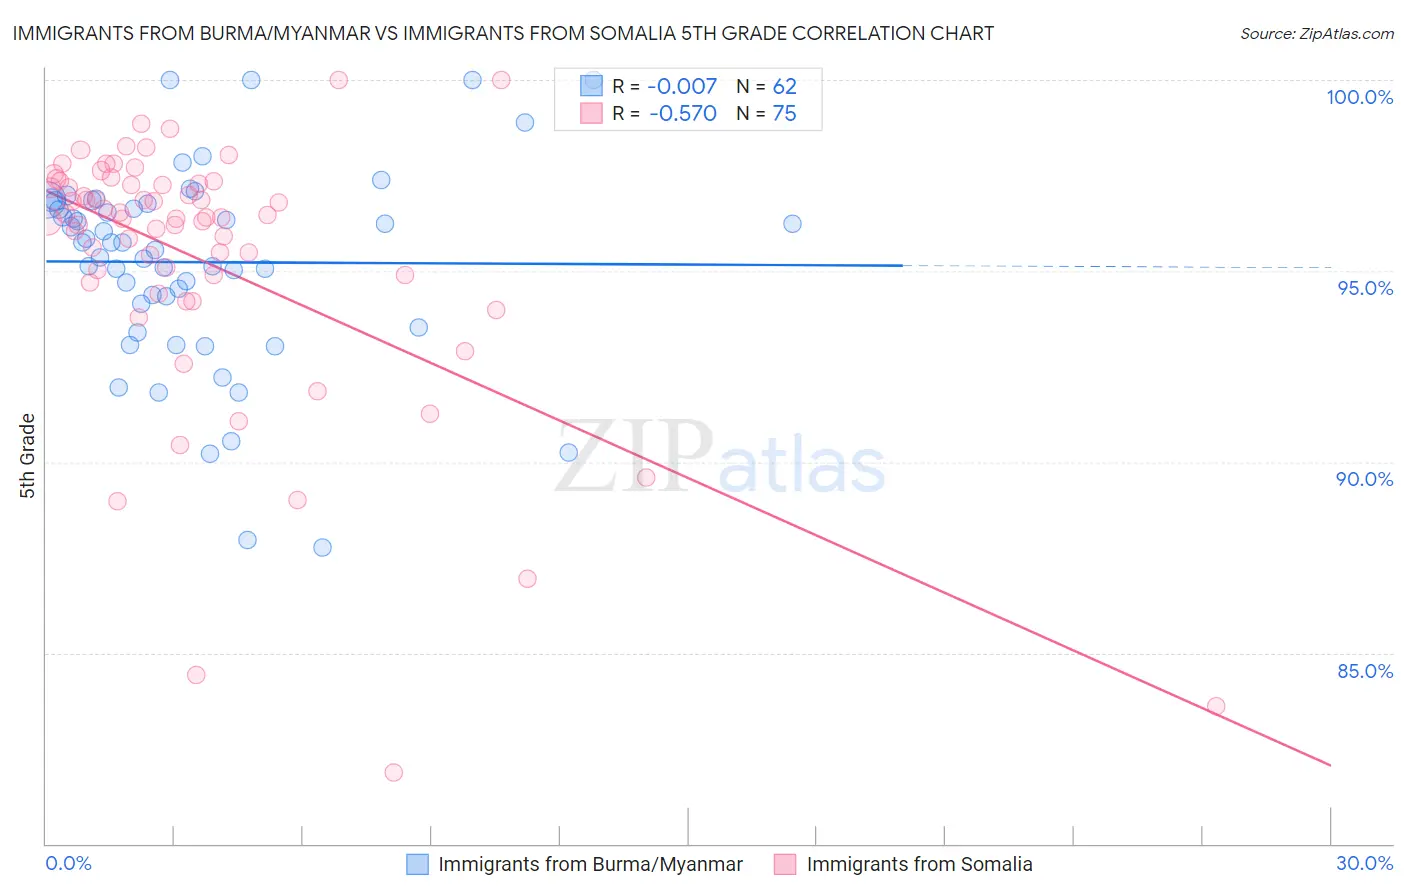
Immigrants from Burma/Myanmar vs Immigrants from Somalia 5th Grade Correlation Chart
The statistical analysis conducted on geographies consisting of 172,326,083 people shows no correlation between the proportion of Immigrants from Burma/Myanmar and percentage of population with at least 5th grade education in the United States with a correlation coefficient (R) of -0.007 and weighted average of 96.1%. Similarly, the statistical analysis conducted on geographies consisting of 92,109,166 people shows a substantial negative correlation between the proportion of Immigrants from Somalia and percentage of population with at least 5th grade education in the United States with a correlation coefficient (R) of -0.570 and weighted average of 96.4%, a difference of 0.34%.
5th Grade Correlation Summary
| Measurement | Immigrants from Burma/Myanmar | Immigrants from Somalia |
| Minimum | 87.8% | 81.9% |
| Maximum | 100.0% | 100.0% |
| Range | 12.2% | 18.1% |
| Mean | 95.2% | 95.3% |
| Median | 95.7% | 96.4% |
| Interquartile 25% (IQ1) | 94.1% | 94.7% |
| Interquartile 75% (IQ3) | 96.8% | 97.3% |
| Interquartile Range (IQR) | 2.7% | 2.6% |
| Standard Deviation (Sample) | 2.6% | 3.5% |
| Standard Deviation (Population) | 2.6% | 3.5% |
Demographics Similar to Immigrants from Burma/Myanmar and Immigrants from Somalia by 5th Grade
In terms of 5th grade, the demographic groups most similar to Immigrants from Burma/Myanmar are Immigrants from Laos (96.0%, a difference of 0.010%), Puerto Rican (96.1%, a difference of 0.030%), Immigrants from Haiti (96.0%, a difference of 0.030%), Immigrants from Caribbean (96.0%, a difference of 0.030%), and Guyanese (96.1%, a difference of 0.040%). Similarly, the demographic groups most similar to Immigrants from Somalia are Immigrants from Eritrea (96.4%, a difference of 0.040%), Immigrants from Grenada (96.5%, a difference of 0.080%), Malaysian (96.5%, a difference of 0.090%), Somali (96.5%, a difference of 0.090%), and British West Indian (96.5%, a difference of 0.10%).
| Demographics | Rating | Rank | 5th Grade |
| Immigrants | West Indies | 0.0 /100 | #289 | Tragic 96.5% |
| British West Indians | 0.0 /100 | #290 | Tragic 96.5% |
| Malaysians | 0.0 /100 | #291 | Tragic 96.5% |
| Somalis | 0.0 /100 | #292 | Tragic 96.5% |
| Immigrants | Grenada | 0.0 /100 | #293 | Tragic 96.5% |
| Immigrants | Eritrea | 0.0 /100 | #294 | Tragic 96.4% |
| Immigrants | Somalia | 0.0 /100 | #295 | Tragic 96.4% |
| Immigrants | South Eastern Asia | 0.0 /100 | #296 | Tragic 96.3% |
| Haitians | 0.0 /100 | #297 | Tragic 96.3% |
| Immigrants | Dominica | 0.0 /100 | #298 | Tragic 96.2% |
| Immigrants | Immigrants | 0.0 /100 | #299 | Tragic 96.2% |
| Sri Lankans | 0.0 /100 | #300 | Tragic 96.1% |
| Immigrants | Cuba | 0.0 /100 | #301 | Tragic 96.1% |
| Guyanese | 0.0 /100 | #302 | Tragic 96.1% |
| Puerto Ricans | 0.0 /100 | #303 | Tragic 96.1% |
| Immigrants | Burma/Myanmar | 0.0 /100 | #304 | Tragic 96.1% |
| Immigrants | Laos | 0.0 /100 | #305 | Tragic 96.0% |
| Immigrants | Haiti | 0.0 /100 | #306 | Tragic 96.0% |
| Immigrants | Caribbean | 0.0 /100 | #307 | Tragic 96.0% |
| Ecuadorians | 0.0 /100 | #308 | Tragic 96.0% |
| Immigrants | Guyana | 0.0 /100 | #309 | Tragic 96.0% |