Immigrants from Belize vs Immigrants from Somalia 9th Grade
COMPARE
Immigrants from Belize
Immigrants from Somalia
9th Grade
9th Grade Comparison
Immigrants from Belize
Immigrants from Somalia
91.8%
9TH GRADE
0.0/ 100
METRIC RATING
324th/ 347
METRIC RANK
94.1%
9TH GRADE
1.4/ 100
METRIC RATING
248th/ 347
METRIC RANK
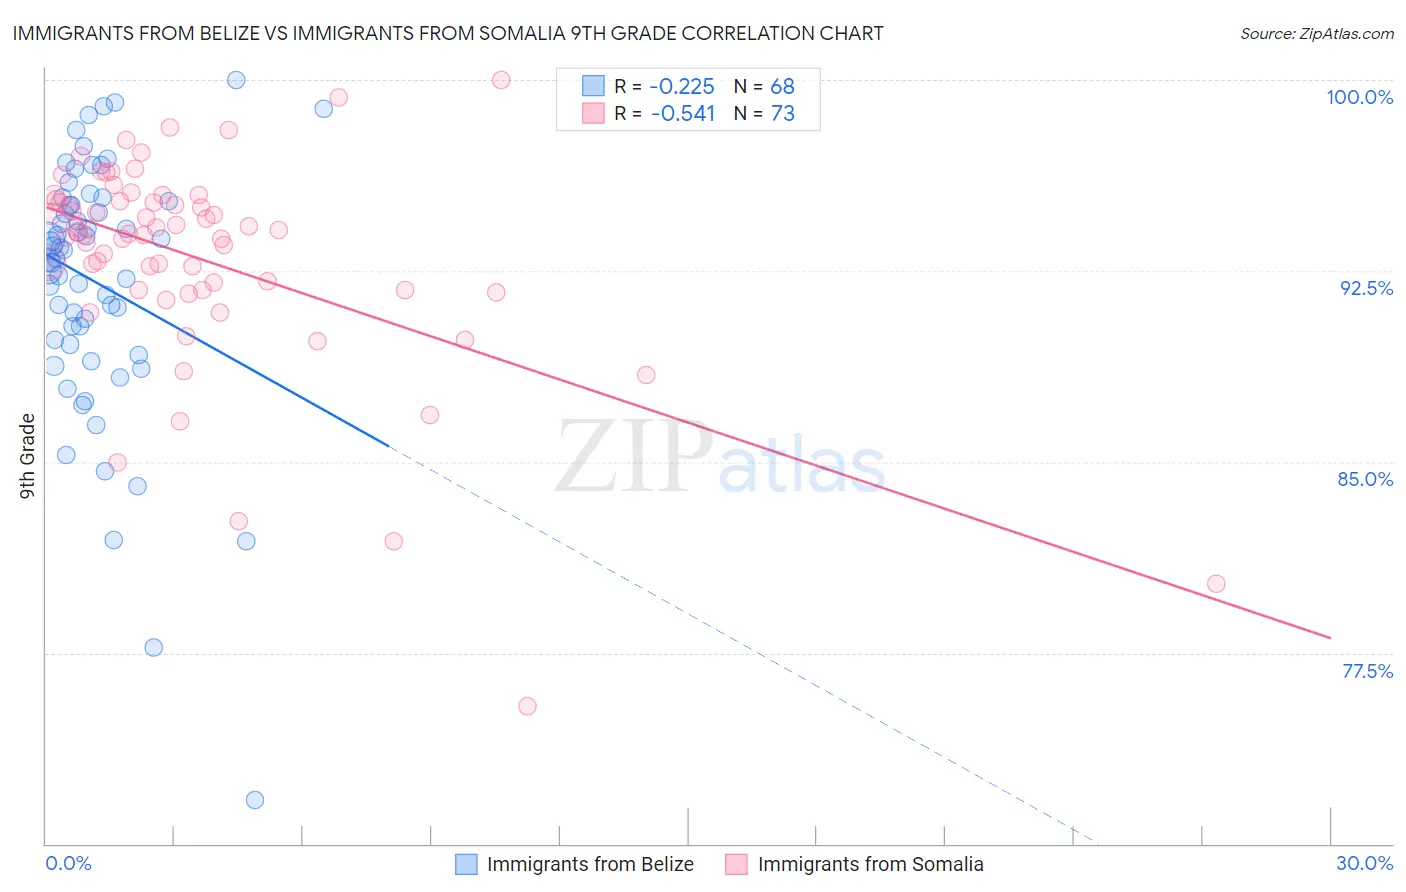
Immigrants from Belize vs Immigrants from Somalia 9th Grade Correlation Chart
The statistical analysis conducted on geographies consisting of 130,181,087 people shows a weak negative correlation between the proportion of Immigrants from Belize and percentage of population with at least 9th grade education in the United States with a correlation coefficient (R) of -0.225 and weighted average of 91.8%. Similarly, the statistical analysis conducted on geographies consisting of 92,097,499 people shows a substantial negative correlation between the proportion of Immigrants from Somalia and percentage of population with at least 9th grade education in the United States with a correlation coefficient (R) of -0.541 and weighted average of 94.1%, a difference of 2.6%.
9th Grade Correlation Summary
| Measurement | Immigrants from Belize | Immigrants from Somalia |
| Minimum | 71.7% | 75.4% |
| Maximum | 100.0% | 100.0% |
| Range | 28.3% | 24.6% |
| Mean | 92.0% | 93.0% |
| Median | 93.2% | 94.0% |
| Interquartile 25% (IQ1) | 89.7% | 91.7% |
| Interquartile 75% (IQ3) | 95.2% | 95.3% |
| Interquartile Range (IQR) | 5.5% | 3.5% |
| Standard Deviation (Sample) | 5.1% | 4.2% |
| Standard Deviation (Population) | 5.0% | 4.2% |
Similar Demographics by 9th Grade
Demographics Similar to Immigrants from Belize by 9th Grade
In terms of 9th grade, the demographic groups most similar to Immigrants from Belize are Belizean (91.8%, a difference of 0.060%), Puerto Rican (91.8%, a difference of 0.060%), Immigrants from Ecuador (91.8%, a difference of 0.090%), Nicaraguan (91.9%, a difference of 0.16%), and Ecuadorian (91.9%, a difference of 0.20%).
| Demographics | Rating | Rank | 9th Grade |
| Immigrants | Cuba | 0.0 /100 | #317 | Tragic 92.2% |
| Nepalese | 0.0 /100 | #318 | Tragic 92.0% |
| Ecuadorians | 0.0 /100 | #319 | Tragic 91.9% |
| Nicaraguans | 0.0 /100 | #320 | Tragic 91.9% |
| Immigrants | Ecuador | 0.0 /100 | #321 | Tragic 91.8% |
| Belizeans | 0.0 /100 | #322 | Tragic 91.8% |
| Puerto Ricans | 0.0 /100 | #323 | Tragic 91.8% |
| Immigrants | Belize | 0.0 /100 | #324 | Tragic 91.8% |
| Central American Indians | 0.0 /100 | #325 | Tragic 91.5% |
| Immigrants | Armenia | 0.0 /100 | #326 | Tragic 91.4% |
| Immigrants | Nicaragua | 0.0 /100 | #327 | Tragic 91.3% |
| Dominicans | 0.0 /100 | #328 | Tragic 91.1% |
| Hondurans | 0.0 /100 | #329 | Tragic 91.0% |
| Immigrants | Cabo Verde | 0.0 /100 | #330 | Tragic 90.9% |
| Mexican American Indians | 0.0 /100 | #331 | Tragic 90.9% |
Demographics Similar to Immigrants from Somalia by 9th Grade
In terms of 9th grade, the demographic groups most similar to Immigrants from Somalia are Uruguayan (94.1%, a difference of 0.010%), Immigrants from Hong Kong (94.1%, a difference of 0.010%), Senegalese (94.2%, a difference of 0.050%), Afghan (94.2%, a difference of 0.050%), and Paiute (94.2%, a difference of 0.060%).
| Demographics | Rating | Rank | 9th Grade |
| Spanish Americans | 2.6 /100 | #241 | Tragic 94.2% |
| Immigrants | Middle Africa | 2.2 /100 | #242 | Tragic 94.2% |
| Immigrants | Cameroon | 2.1 /100 | #243 | Tragic 94.2% |
| Dutch West Indians | 2.0 /100 | #244 | Tragic 94.2% |
| Paiute | 1.9 /100 | #245 | Tragic 94.2% |
| Senegalese | 1.9 /100 | #246 | Tragic 94.2% |
| Afghans | 1.8 /100 | #247 | Tragic 94.2% |
| Immigrants | Somalia | 1.4 /100 | #248 | Tragic 94.1% |
| Uruguayans | 1.3 /100 | #249 | Tragic 94.1% |
| Immigrants | Hong Kong | 1.3 /100 | #250 | Tragic 94.1% |
| Jamaicans | 1.0 /100 | #251 | Tragic 94.1% |
| Immigrants | Senegal | 0.9 /100 | #252 | Tragic 94.1% |
| Colombians | 0.8 /100 | #253 | Tragic 94.0% |
| U.S. Virgin Islanders | 0.7 /100 | #254 | Tragic 94.0% |
| Immigrants | Nigeria | 0.6 /100 | #255 | Tragic 94.0% |