Immigrants from Burma/Myanmar vs Immigrants from Uganda 9th Grade
COMPARE
Immigrants from Burma/Myanmar
Immigrants from Uganda
9th Grade
9th Grade Comparison
Immigrants from Burma/Myanmar
Immigrants from Uganda
93.1%
9TH GRADE
0.0/ 100
METRIC RATING
295th/ 347
METRIC RANK
94.8%
9TH GRADE
43.1/ 100
METRIC RATING
180th/ 347
METRIC RANK
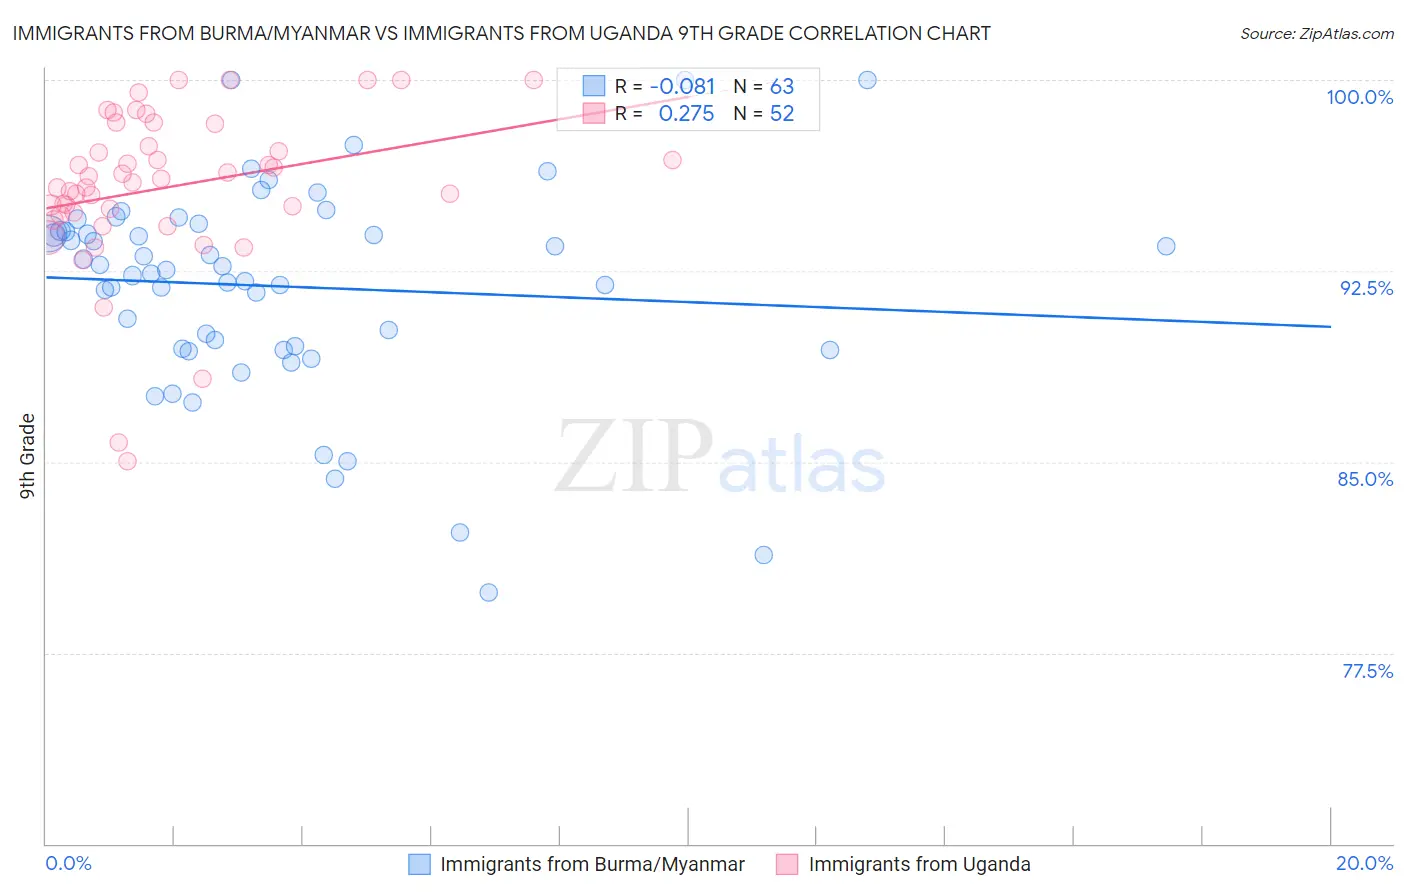
Immigrants from Burma/Myanmar vs Immigrants from Uganda 9th Grade Correlation Chart
The statistical analysis conducted on geographies consisting of 172,345,696 people shows a slight negative correlation between the proportion of Immigrants from Burma/Myanmar and percentage of population with at least 9th grade education in the United States with a correlation coefficient (R) of -0.081 and weighted average of 93.1%. Similarly, the statistical analysis conducted on geographies consisting of 125,943,496 people shows a weak positive correlation between the proportion of Immigrants from Uganda and percentage of population with at least 9th grade education in the United States with a correlation coefficient (R) of 0.275 and weighted average of 94.8%, a difference of 1.8%.
9th Grade Correlation Summary
| Measurement | Immigrants from Burma/Myanmar | Immigrants from Uganda |
| Minimum | 79.9% | 85.0% |
| Maximum | 100.0% | 100.0% |
| Range | 20.1% | 15.0% |
| Mean | 91.9% | 95.8% |
| Median | 92.5% | 96.1% |
| Interquartile 25% (IQ1) | 89.4% | 94.7% |
| Interquartile 75% (IQ3) | 94.1% | 97.8% |
| Interquartile Range (IQR) | 4.6% | 3.1% |
| Standard Deviation (Sample) | 4.1% | 3.1% |
| Standard Deviation (Population) | 4.1% | 3.1% |
Similar Demographics by 9th Grade
Demographics Similar to Immigrants from Burma/Myanmar by 9th Grade
In terms of 9th grade, the demographic groups most similar to Immigrants from Burma/Myanmar are Indonesian (93.1%, a difference of 0.0%), Sri Lankan (93.2%, a difference of 0.020%), Cuban (93.2%, a difference of 0.020%), Fijian (93.1%, a difference of 0.030%), and Immigrants from Laos (93.2%, a difference of 0.040%).
| Demographics | Rating | Rank | 9th Grade |
| Immigrants | South Eastern Asia | 0.0 /100 | #288 | Tragic 93.3% |
| Immigrants | West Indies | 0.0 /100 | #289 | Tragic 93.3% |
| Pennsylvania Germans | 0.0 /100 | #290 | Tragic 93.3% |
| British West Indians | 0.0 /100 | #291 | Tragic 93.2% |
| Immigrants | Laos | 0.0 /100 | #292 | Tragic 93.2% |
| Sri Lankans | 0.0 /100 | #293 | Tragic 93.2% |
| Cubans | 0.0 /100 | #294 | Tragic 93.2% |
| Immigrants | Burma/Myanmar | 0.0 /100 | #295 | Tragic 93.1% |
| Indonesians | 0.0 /100 | #296 | Tragic 93.1% |
| Fijians | 0.0 /100 | #297 | Tragic 93.1% |
| Haitians | 0.0 /100 | #298 | Tragic 93.1% |
| Immigrants | Grenada | 0.0 /100 | #299 | Tragic 93.0% |
| Yaqui | 0.0 /100 | #300 | Tragic 92.9% |
| Immigrants | Haiti | 0.0 /100 | #301 | Tragic 92.7% |
| Immigrants | Dominica | 0.0 /100 | #302 | Tragic 92.7% |
Demographics Similar to Immigrants from Uganda by 9th Grade
In terms of 9th grade, the demographic groups most similar to Immigrants from Uganda are Sierra Leonean (94.8%, a difference of 0.0%), Seminole (94.8%, a difference of 0.0%), Immigrants from Venezuela (94.9%, a difference of 0.020%), Immigrants from Iraq (94.9%, a difference of 0.030%), and Immigrants from Poland (94.9%, a difference of 0.030%).
| Demographics | Rating | Rank | 9th Grade |
| Cheyenne | 51.5 /100 | #173 | Average 94.9% |
| Immigrants | Egypt | 50.0 /100 | #174 | Average 94.9% |
| Brazilians | 49.8 /100 | #175 | Average 94.9% |
| Immigrants | Spain | 49.1 /100 | #176 | Average 94.9% |
| Immigrants | Iraq | 47.8 /100 | #177 | Average 94.9% |
| Immigrants | Poland | 46.7 /100 | #178 | Average 94.9% |
| Immigrants | Venezuela | 46.5 /100 | #179 | Average 94.9% |
| Immigrants | Uganda | 43.1 /100 | #180 | Average 94.8% |
| Sierra Leoneans | 42.7 /100 | #181 | Average 94.8% |
| Seminole | 42.5 /100 | #182 | Average 94.8% |
| Immigrants | Nepal | 39.7 /100 | #183 | Fair 94.8% |
| Argentineans | 37.6 /100 | #184 | Fair 94.8% |
| Liberians | 37.4 /100 | #185 | Fair 94.8% |
| Hopi | 37.1 /100 | #186 | Fair 94.8% |
| Guamanians/Chamorros | 35.5 /100 | #187 | Fair 94.8% |