Immigrants from Burma/Myanmar vs Immigrants from Moldova Single Mother Households

COMPARE

Immigrants from Burma/Myanmar
Race
Ancestry
AfghanAfricanAlaska NativeAlaskan AthabascanAlbanianAleutAlsatianAmericanApacheArabArapahoArgentineanArmenianAssyrian/Chaldean/SyriacAustralianAustrianBahamianBangladeshiBarbadianBasqueBelgianBelizeanBermudanBhutaneseBlackfeetBolivianBrazilianBritishBritish West IndianBulgarianBurmeseCajunCambodianCanadianCape VerdeanCarpatho RusynCelticCentral AmericanCentral American IndianCherokeeCheyenneChickasawChileanChineseChippewaChoctawColombianColvilleComancheCosta RicanCreeCreekCroatianCrowCubanCypriotCzechCzechoslovakianDanishDelawareDominicanDutchDutch West IndianEastern EuropeanEcuadorianEgyptianEnglishEstonianEthiopianEuropeanFijianFilipinoFinnishFrenchFrench American IndianFrench CanadianGermanGerman RussianGhanaianGreekGuamanian/ChamorroGuatemalanGuyaneseHaitianHmongHonduranHopiHoumaHungarianIcelanderIndian (Asian)IndonesianInupiatIranianIraqiIrishIroquoisIsraeliItalianJamaicanJapaneseJordanianKenyanKiowaKoreanLaotianLatvianLebaneseLiberianLithuanianLumbeeLuxembourgerMacedonianMalaysianMalteseMarshalleseMenomineeMexicanMexican American IndianMongolianMoroccanNative HawaiianNavajoNepaleseNew ZealanderNicaraguanNigerianNorthern EuropeanNorwegianOkinawanOsageOttawaPaiutePakistaniPalestinianPanamanianParaguayanPennsylvania GermanPeruvianPimaPolishPortuguesePotawatomiPuebloPuerto RicanPuget Sound SalishRomanianRussianSalvadoranSamoanScandinavianScotch-IrishScottishSeminoleSenegaleseSerbianShoshoneSierra LeoneanSiouxSlavicSlovakSloveneSomaliSouth AfricanSouth AmericanSouth American IndianSoviet UnionSpaniardSpanishSpanish AmericanSpanish American IndianSri LankanSubsaharan AfricanSudaneseSwedishSwissSyrianTaiwaneseThaiTlingit-HaidaTohono O'OdhamTonganTrinidadian and TobagonianTsimshianTurkishU.S. Virgin IslanderUgandanUkrainianUruguayanUteVenezuelanVietnameseWelshWest IndianYakamaYaquiYugoslavianYumanYup'ikZimbabwean
Immigration
NonimmigrantsImmigrantsAfghanistanAfricaAlbaniaArgentinaArmeniaAsiaAustraliaAustriaBahamasBangladeshBarbadosBelarusBelgiumBelizeBoliviaBosnia and HerzegovinaBrazilBulgariaBurma/MyanmarCabo VerdeCambodiaCameroonCanadaCaribbeanCentral AmericaChileChinaColombiaCongoCosta RicaCroatiaCubaCzechoslovakiaDenmarkDominicaDominican RepublicEastern AfricaEastern AsiaEastern EuropeEcuadorEgyptEl SalvadorEnglandEritreaEthiopiaEuropeFijiFranceGermanyGhanaGreeceGrenadaGuatemalaGuyanaHaitiHondurasHong KongHungaryIndiaIndonesiaIranIraqIrelandIsraelItalyJamaicaJapanJordanKazakhstanKenyaKoreaKuwaitLaosLatin AmericaLatviaLebanonLiberiaLithuaniaMalaysiaMexicoMicronesiaMiddle AfricaMoroccoNepalNetherlandsNicaraguaNigeriaNorth AmericaNorth MacedoniaNorthern AfricaNorthern EuropeNorwayOceaniaPakistanPanamaPeruPhilippinesPolandPortugalRomaniaRussiaSaudi ArabiaScotlandSenegalSerbiaSierra LeoneSingaporeSomaliaSouth AfricaSouth AmericaSouth Central AsiaSouth Eastern AsiaSouthern EuropeSpainSri LankaSt. Vincent and the GrenadinesSudanSwedenSwitzerlandSyriaTaiwanThailandTrinidad and TobagoTurkeyUgandaUkraineUruguayUzbekistanVenezuelaVietnamWest IndiesWestern AfricaWestern AsiaWestern EuropeYemenZaireZimbabweAzores
Immigrants from Moldova
Race
Ancestry
AfghanAfricanAlaska NativeAlaskan AthabascanAlbanianAleutAlsatianAmericanApacheArabArapahoArgentineanArmenianAssyrian/Chaldean/SyriacAustralianAustrianBahamianBangladeshiBarbadianBasqueBelgianBelizeanBermudanBhutaneseBlackfeetBolivianBrazilianBritishBritish West IndianBulgarianBurmeseCajunCambodianCanadianCape VerdeanCarpatho RusynCelticCentral AmericanCentral American IndianCherokeeCheyenneChickasawChileanChineseChippewaChoctawColombianColvilleComancheCosta RicanCreeCreekCroatianCrowCubanCypriotCzechCzechoslovakianDanishDelawareDominicanDutchDutch West IndianEastern EuropeanEcuadorianEgyptianEnglishEstonianEthiopianEuropeanFijianFilipinoFinnishFrenchFrench American IndianFrench CanadianGermanGerman RussianGhanaianGreekGuamanian/ChamorroGuatemalanGuyaneseHaitianHmongHonduranHopiHoumaHungarianIcelanderIndian (Asian)IndonesianInupiatIranianIraqiIrishIroquoisIsraeliItalianJamaicanJapaneseJordanianKenyanKiowaKoreanLaotianLatvianLebaneseLiberianLithuanianLumbeeLuxembourgerMacedonianMalaysianMalteseMarshalleseMenomineeMexicanMexican American IndianMongolianMoroccanNative HawaiianNavajoNepaleseNew ZealanderNicaraguanNigerianNorthern EuropeanNorwegianOkinawanOsageOttawaPaiutePakistaniPalestinianPanamanianParaguayanPennsylvania GermanPeruvianPimaPolishPortuguesePotawatomiPuebloPuerto RicanPuget Sound SalishRomanianRussianSalvadoranSamoanScandinavianScotch-IrishScottishSeminoleSenegaleseSerbianShoshoneSierra LeoneanSiouxSlavicSlovakSloveneSomaliSouth AfricanSouth AmericanSouth American IndianSoviet UnionSpaniardSpanishSpanish AmericanSpanish American IndianSri LankanSubsaharan AfricanSudaneseSwedishSwissSyrianTaiwaneseThaiTlingit-HaidaTohono O'OdhamTonganTrinidadian and TobagonianTsimshianTurkishU.S. Virgin IslanderUgandanUkrainianUruguayanUteVenezuelanVietnameseWelshWest IndianYakamaYaquiYugoslavianYumanYup'ikZimbabwean
Immigration
NonimmigrantsImmigrantsAfghanistanAfricaAlbaniaArgentinaArmeniaAsiaAustraliaAustriaBahamasBangladeshBarbadosBelarusBelgiumBelizeBoliviaBosnia and HerzegovinaBrazilBulgariaCabo VerdeCambodiaCameroonCanadaCaribbeanCentral AmericaChileChinaColombiaCongoCosta RicaCroatiaCubaCzechoslovakiaDenmarkDominicaDominican RepublicEastern AfricaEastern AsiaEastern EuropeEcuadorEgyptEl SalvadorEnglandEritreaEthiopiaEuropeFijiFranceGermanyGhanaGreeceGrenadaGuatemalaGuyanaHaitiHondurasHong KongHungaryIndiaIndonesiaIranIraqIrelandIsraelItalyJamaicaJapanJordanKazakhstanKenyaKoreaKuwaitLaosLatin AmericaLatviaLebanonLiberiaLithuaniaMalaysiaMexicoMicronesiaMiddle AfricaMoldovaMoroccoNepalNetherlandsNicaraguaNigeriaNorth AmericaNorth MacedoniaNorthern AfricaNorthern EuropeNorwayOceaniaPakistanPanamaPeruPhilippinesPolandPortugalRomaniaRussiaSaudi ArabiaScotlandSenegalSerbiaSierra LeoneSingaporeSomaliaSouth AfricaSouth AmericaSouth Central AsiaSouth Eastern AsiaSouthern EuropeSpainSri LankaSt. Vincent and the GrenadinesSudanSwedenSwitzerlandSyriaTaiwanThailandTrinidad and TobagoTurkeyUgandaUkraineUruguayUzbekistanVenezuelaVietnamWest IndiesWestern AfricaWestern AsiaWestern EuropeYemenZaireZimbabweAzores
Single Mother Households
Income
Poverty
Unemployment
Labor Participation
Family Structure
Vehicle Availability
Education Level
Disability

Single Mother Households Comparison

Immigrants from Burma/Myanmar

Immigrants from Moldova

Tragic
Exceptional
7.0%
SINGLE MOTHER HOUSEHOLDS
1.4/ 100
METRIC RATING
235th/ 347
METRIC RANK
5.6%
SINGLE MOTHER HOUSEHOLDS
97.9/ 100
METRIC RATING
81st/ 347
METRIC RANK

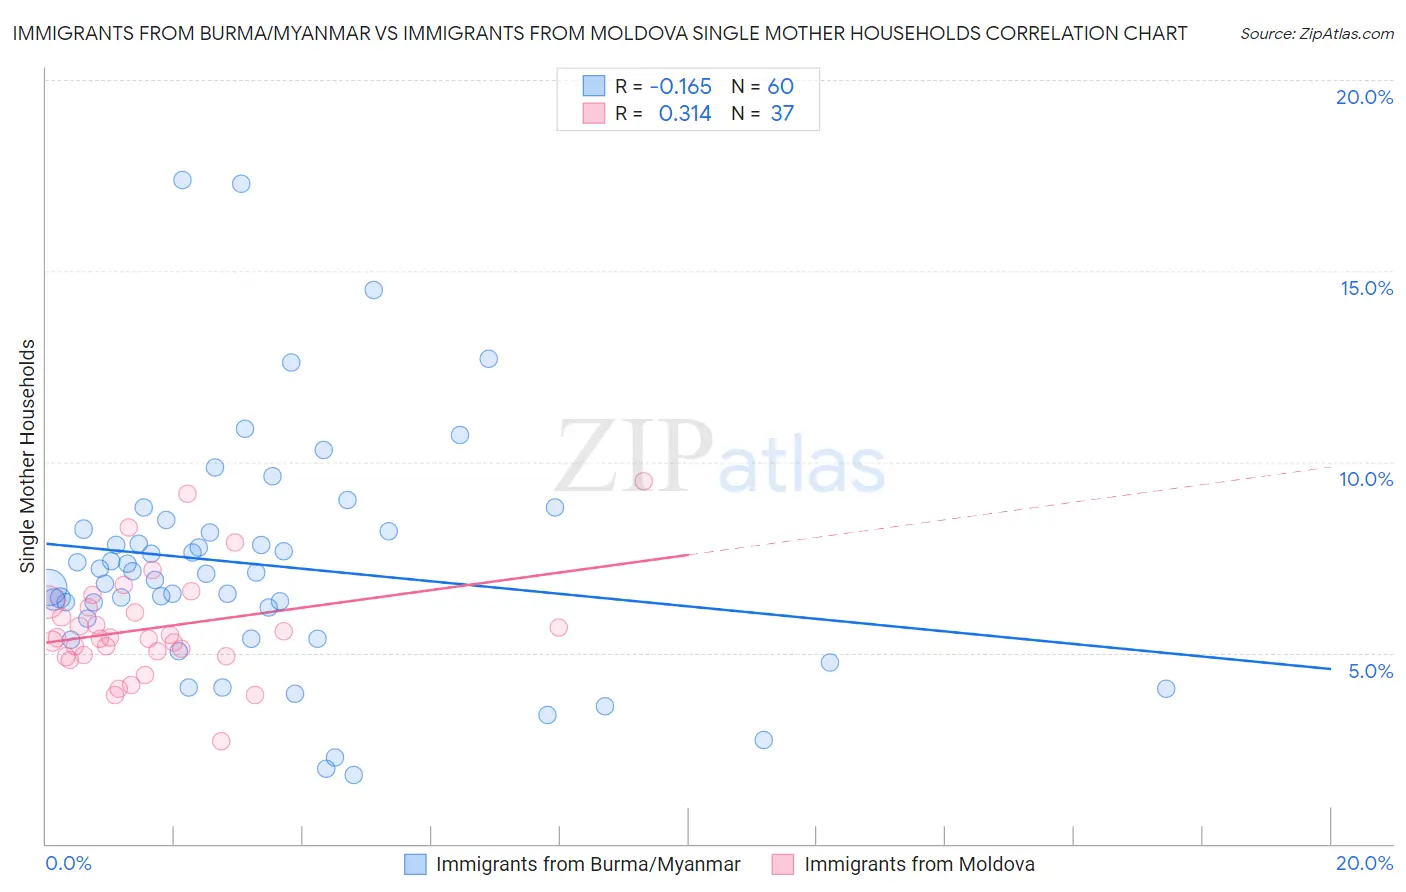
Immigrants from Burma/Myanmar vs Immigrants from Moldova Single Mother Households Correlation Chart

The statistical analysis conducted on geographies consisting of 172,110,214 people shows a poor negative correlation between the proportion of Immigrants from Burma/Myanmar and percentage of single mother households in the United States with a correlation coefficient (R) of -0.165 and weighted average of 7.0%. Similarly, the statistical analysis conducted on geographies consisting of 124,294,773 people shows a mild positive correlation between the proportion of Immigrants from Moldova and percentage of single mother households in the United States with a correlation coefficient (R) of 0.314 and weighted average of 5.6%, a difference of 24.8%.
Immigrants from Burma/Myanmar vs Immigrants from Moldova Single Mother Households

Single Mother Households Correlation Summary

MeasurementImmigrants from Burma/MyanmarImmigrants from Moldova
Minimum1.8%2.7%
Maximum17.4%9.5%
Range15.6%6.8%
Mean7.3%5.7%
Median7.1%5.4%
Interquartile 25% (IQ1)5.6%4.9%
Interquartile 75% (IQ3)8.2%6.3%
Interquartile Range (IQR)2.6%1.3%
Standard Deviation (Sample)3.1%1.4%
Standard Deviation (Population)3.1%1.4%

Similar Demographics by Single Mother Households

Demographics Similar to Immigrants from Burma/Myanmar by Single Mother Households

In terms of single mother households, the demographic groups most similar to Immigrants from Burma/Myanmar are Chickasaw (7.0%, a difference of 0.070%), Choctaw (7.0%, a difference of 0.090%), Comanche (7.0%, a difference of 0.26%), Spanish American (7.0%, a difference of 0.32%), and Creek (7.0%, a difference of 0.34%).
DemographicsRating | RankSingle Mother Households
Iroquois
2.2
/100
|
#228
Tragic
7.0%
Immigrants | Kenya
2.1
/100
|
#229
Tragic
7.0%
Creek
1.6
/100
|
#230
Tragic
7.0%
Spanish Americans
1.6
/100
|
#231
Tragic
7.0%
Comanche
1.5
/100
|
#232
Tragic
7.0%
Choctaw
1.4
/100
|
#233
Tragic
7.0%
Chickasaw
1.4
/100
|
#234
Tragic
7.0%
Immigrants | Burma/Myanmar
1.4
/100
|
#235
Tragic
7.0%
Ute
1.0
/100
|
#236
Tragic
7.1%
Arapaho
1.0
/100
|
#237
Tragic
7.1%
Panamanians
0.9
/100
|
#238
Tragic
7.1%
Kiowa
0.8
/100
|
#239
Tragic
7.1%
Immigrants | Panama
0.7
/100
|
#240
Tragic
7.2%
Immigrants | Portugal
0.6
/100
|
#241
Tragic
7.2%
Fijians
0.6
/100
|
#242
Tragic
7.2%

Demographics Similar to Immigrants from Moldova by Single Mother Households

In terms of single mother households, the demographic groups most similar to Immigrants from Moldova are Czech (5.6%, a difference of 0.0%), Immigrants from Sri Lanka (5.6%, a difference of 0.11%), Immigrants from Malaysia (5.7%, a difference of 0.21%), Immigrants from Hungary (5.7%, a difference of 0.24%), and Swiss (5.6%, a difference of 0.31%).
DemographicsRating | RankSingle Mother Households
Immigrants | North America
98.3
/100
|
#74
Exceptional
5.6%
Slovenes
98.3
/100
|
#75
Exceptional
5.6%
New Zealanders
98.2
/100
|
#76
Exceptional
5.6%
Romanians
98.1
/100
|
#77
Exceptional
5.6%
Swiss
98.1
/100
|
#78
Exceptional
5.6%
Immigrants | Sri Lanka
98.0
/100
|
#79
Exceptional
5.6%
Czechs
97.9
/100
|
#80
Exceptional
5.6%
Immigrants | Moldova
97.9
/100
|
#81
Exceptional
5.6%
Immigrants | Malaysia
97.8
/100
|
#82
Exceptional
5.7%
Immigrants | Hungary
97.8
/100
|
#83
Exceptional
5.7%
Carpatho Rusyns
97.7
/100
|
#84
Exceptional
5.7%
Hungarians
97.6
/100
|
#85
Exceptional
5.7%
Finns
97.6
/100
|
#86
Exceptional
5.7%
Immigrants | Turkey
97.5
/100
|
#87
Exceptional
5.7%
Israelis
97.4
/100
|
#88
Exceptional
5.7%