Fijian vs Immigrants from Iraq No Schooling Completed
COMPARE
Fijian
Immigrants from Iraq
No Schooling Completed
No Schooling Completed Comparison
Fijians
Immigrants from Iraq
2.5%
NO SCHOOLING COMPLETED
0.4/ 100
METRIC RATING
266th/ 347
METRIC RANK
2.4%
NO SCHOOLING COMPLETED
1.3/ 100
METRIC RATING
247th/ 347
METRIC RANK
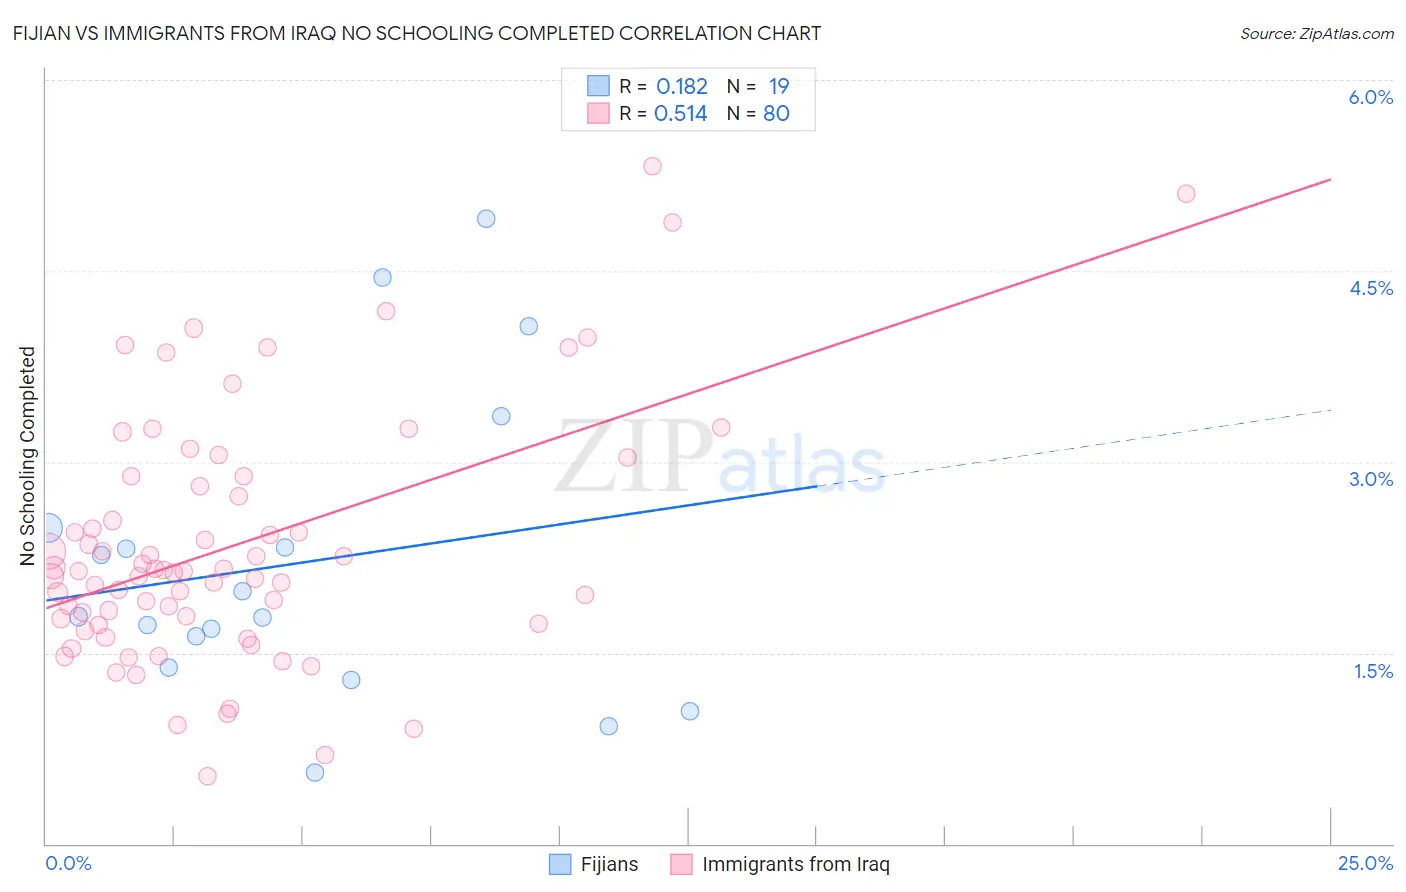
Fijian vs Immigrants from Iraq No Schooling Completed Correlation Chart
The statistical analysis conducted on geographies consisting of 55,808,441 people shows a poor positive correlation between the proportion of Fijians and percentage of population with no schooling in the United States with a correlation coefficient (R) of 0.182 and weighted average of 2.5%. Similarly, the statistical analysis conducted on geographies consisting of 194,285,725 people shows a substantial positive correlation between the proportion of Immigrants from Iraq and percentage of population with no schooling in the United States with a correlation coefficient (R) of 0.514 and weighted average of 2.4%, a difference of 3.7%.
No Schooling Completed Correlation Summary
| Measurement | Fijian | Immigrants from Iraq |
| Minimum | 0.56% | 0.53% |
| Maximum | 4.9% | 5.3% |
| Range | 4.4% | 4.8% |
| Mean | 2.2% | 2.3% |
| Median | 1.8% | 2.1% |
| Interquartile 25% (IQ1) | 1.4% | 1.7% |
| Interquartile 75% (IQ3) | 2.5% | 2.8% |
| Interquartile Range (IQR) | 1.1% | 1.1% |
| Standard Deviation (Sample) | 1.2% | 0.98% |
| Standard Deviation (Population) | 1.2% | 0.97% |
Demographics Similar to Fijians and Immigrants from Iraq by No Schooling Completed
In terms of no schooling completed, the demographic groups most similar to Fijians are West Indian (2.5%, a difference of 0.080%), Indian (Asian) (2.5%, a difference of 0.26%), Immigrants from Liberia (2.5%, a difference of 0.39%), Immigrants from Sierra Leone (2.5%, a difference of 0.56%), and Armenian (2.5%, a difference of 0.91%). Similarly, the demographic groups most similar to Immigrants from Iraq are Immigrants from Congo (2.4%, a difference of 0.11%), Asian (2.4%, a difference of 0.27%), Jamaican (2.4%, a difference of 0.45%), Immigrants from Middle Africa (2.4%, a difference of 0.50%), and Immigrants from Africa (2.4%, a difference of 0.52%).
| Demographics | Rating | Rank | No Schooling Completed |
| Immigrants | Congo | 1.4 /100 | #246 | Tragic 2.4% |
| Immigrants | Iraq | 1.3 /100 | #247 | Tragic 2.4% |
| Asians | 1.2 /100 | #248 | Tragic 2.4% |
| Jamaicans | 1.2 /100 | #249 | Tragic 2.4% |
| Immigrants | Middle Africa | 1.1 /100 | #250 | Tragic 2.4% |
| Immigrants | Africa | 1.1 /100 | #251 | Tragic 2.4% |
| Immigrants | Colombia | 1.0 /100 | #252 | Tragic 2.4% |
| Immigrants | Asia | 0.9 /100 | #253 | Tragic 2.4% |
| Immigrants | Eastern Africa | 0.9 /100 | #254 | Tragic 2.4% |
| Ethiopians | 0.8 /100 | #255 | Tragic 2.4% |
| Yaqui | 0.8 /100 | #256 | Tragic 2.4% |
| Immigrants | South America | 0.6 /100 | #257 | Tragic 2.5% |
| Assyrians/Chaldeans/Syriacs | 0.6 /100 | #258 | Tragic 2.5% |
| Immigrants | Jamaica | 0.6 /100 | #259 | Tragic 2.5% |
| Immigrants | Ethiopia | 0.6 /100 | #260 | Tragic 2.5% |
| Armenians | 0.5 /100 | #261 | Tragic 2.5% |
| Immigrants | Sierra Leone | 0.5 /100 | #262 | Tragic 2.5% |
| Immigrants | Liberia | 0.4 /100 | #263 | Tragic 2.5% |
| Indians (Asian) | 0.4 /100 | #264 | Tragic 2.5% |
| West Indians | 0.4 /100 | #265 | Tragic 2.5% |
| Fijians | 0.4 /100 | #266 | Tragic 2.5% |