Scottish vs Immigrants from Iraq No Schooling Completed
COMPARE
Scottish
Immigrants from Iraq
No Schooling Completed
No Schooling Completed Comparison
Scottish
Immigrants from Iraq
1.4%
NO SCHOOLING COMPLETED
100.0/ 100
METRIC RATING
9th/ 347
METRIC RANK
2.4%
NO SCHOOLING COMPLETED
1.3/ 100
METRIC RATING
247th/ 347
METRIC RANK
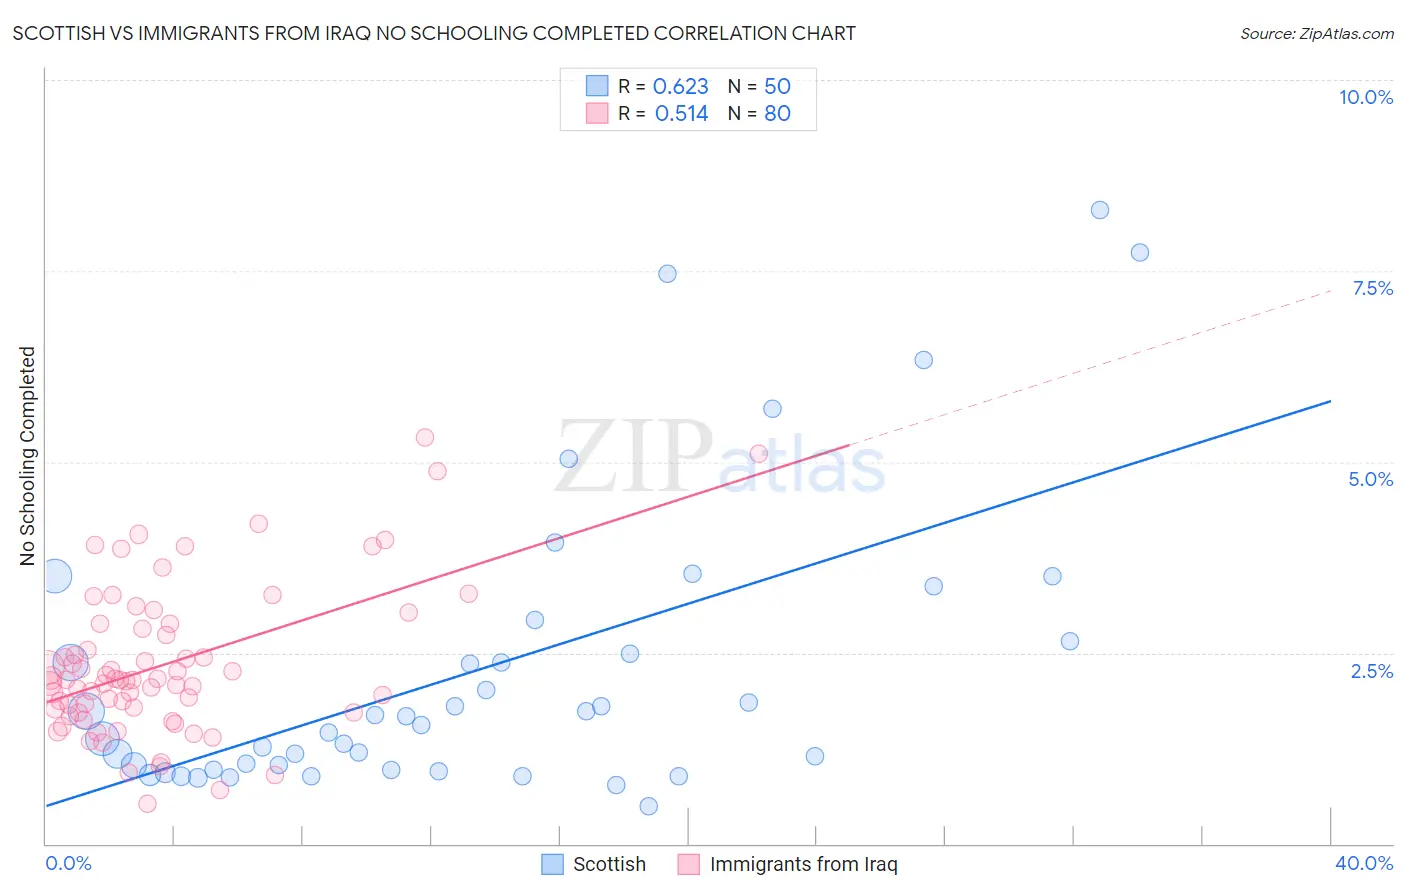
Scottish vs Immigrants from Iraq No Schooling Completed Correlation Chart
The statistical analysis conducted on geographies consisting of 548,415,962 people shows a significant positive correlation between the proportion of Scottish and percentage of population with no schooling in the United States with a correlation coefficient (R) of 0.623 and weighted average of 1.4%. Similarly, the statistical analysis conducted on geographies consisting of 194,285,725 people shows a substantial positive correlation between the proportion of Immigrants from Iraq and percentage of population with no schooling in the United States with a correlation coefficient (R) of 0.514 and weighted average of 2.4%, a difference of 69.2%.
No Schooling Completed Correlation Summary
| Measurement | Scottish | Immigrants from Iraq |
| Minimum | 0.50% | 0.53% |
| Maximum | 8.3% | 5.3% |
| Range | 7.8% | 4.8% |
| Mean | 2.3% | 2.3% |
| Median | 1.6% | 2.1% |
| Interquartile 25% (IQ1) | 0.97% | 1.7% |
| Interquartile 75% (IQ3) | 2.7% | 2.8% |
| Interquartile Range (IQR) | 1.7% | 1.1% |
| Standard Deviation (Sample) | 1.9% | 0.98% |
| Standard Deviation (Population) | 1.9% | 0.97% |
Similar Demographics by No Schooling Completed
Demographics Similar to Scottish by No Schooling Completed
In terms of no schooling completed, the demographic groups most similar to Scottish are Swedish (1.4%, a difference of 0.53%), Dutch (1.4%, a difference of 0.80%), Lithuanian (1.4%, a difference of 1.6%), Irish (1.4%, a difference of 1.7%), and Polish (1.4%, a difference of 1.7%).
| Demographics | Rating | Rank | No Schooling Completed |
| Slovaks | 100.0 /100 | #2 | Exceptional 1.3% |
| Norwegians | 100.0 /100 | #3 | Exceptional 1.3% |
| Germans | 100.0 /100 | #4 | Exceptional 1.4% |
| Slovenes | 100.0 /100 | #5 | Exceptional 1.4% |
| Carpatho Rusyns | 100.0 /100 | #6 | Exceptional 1.4% |
| English | 100.0 /100 | #7 | Exceptional 1.4% |
| Swedes | 100.0 /100 | #8 | Exceptional 1.4% |
| Scottish | 100.0 /100 | #9 | Exceptional 1.4% |
| Dutch | 100.0 /100 | #10 | Exceptional 1.4% |
| Lithuanians | 100.0 /100 | #11 | Exceptional 1.4% |
| Irish | 100.0 /100 | #12 | Exceptional 1.4% |
| Poles | 100.0 /100 | #13 | Exceptional 1.4% |
| Scotch-Irish | 100.0 /100 | #14 | Exceptional 1.5% |
| Tlingit-Haida | 100.0 /100 | #15 | Exceptional 1.5% |
| Finns | 100.0 /100 | #16 | Exceptional 1.5% |
Demographics Similar to Immigrants from Iraq by No Schooling Completed
In terms of no schooling completed, the demographic groups most similar to Immigrants from Iraq are Immigrants from Congo (2.4%, a difference of 0.11%), Peruvian (2.4%, a difference of 0.16%), Bolivian (2.4%, a difference of 0.16%), South American (2.4%, a difference of 0.27%), and Asian (2.4%, a difference of 0.27%).
| Demographics | Rating | Rank | No Schooling Completed |
| Immigrants | Senegal | 1.7 /100 | #240 | Tragic 2.4% |
| Koreans | 1.7 /100 | #241 | Tragic 2.4% |
| Immigrants | Indonesia | 1.5 /100 | #242 | Tragic 2.4% |
| South Americans | 1.5 /100 | #243 | Tragic 2.4% |
| Peruvians | 1.4 /100 | #244 | Tragic 2.4% |
| Bolivians | 1.4 /100 | #245 | Tragic 2.4% |
| Immigrants | Congo | 1.4 /100 | #246 | Tragic 2.4% |
| Immigrants | Iraq | 1.3 /100 | #247 | Tragic 2.4% |
| Asians | 1.2 /100 | #248 | Tragic 2.4% |
| Jamaicans | 1.2 /100 | #249 | Tragic 2.4% |
| Immigrants | Middle Africa | 1.1 /100 | #250 | Tragic 2.4% |
| Immigrants | Africa | 1.1 /100 | #251 | Tragic 2.4% |
| Immigrants | Colombia | 1.0 /100 | #252 | Tragic 2.4% |
| Immigrants | Asia | 0.9 /100 | #253 | Tragic 2.4% |
| Immigrants | Eastern Africa | 0.9 /100 | #254 | Tragic 2.4% |