Immigrants from Israel vs Immigrants from Honduras High School Diploma
COMPARE
Immigrants from Israel
Immigrants from Honduras
High School Diploma
High School Diploma Comparison
Immigrants from Israel
Immigrants from Honduras
90.5%
HIGH SCHOOL DIPLOMA
98.5/ 100
METRIC RATING
94th/ 347
METRIC RANK
82.5%
HIGH SCHOOL DIPLOMA
0.0/ 100
METRIC RATING
332nd/ 347
METRIC RANK
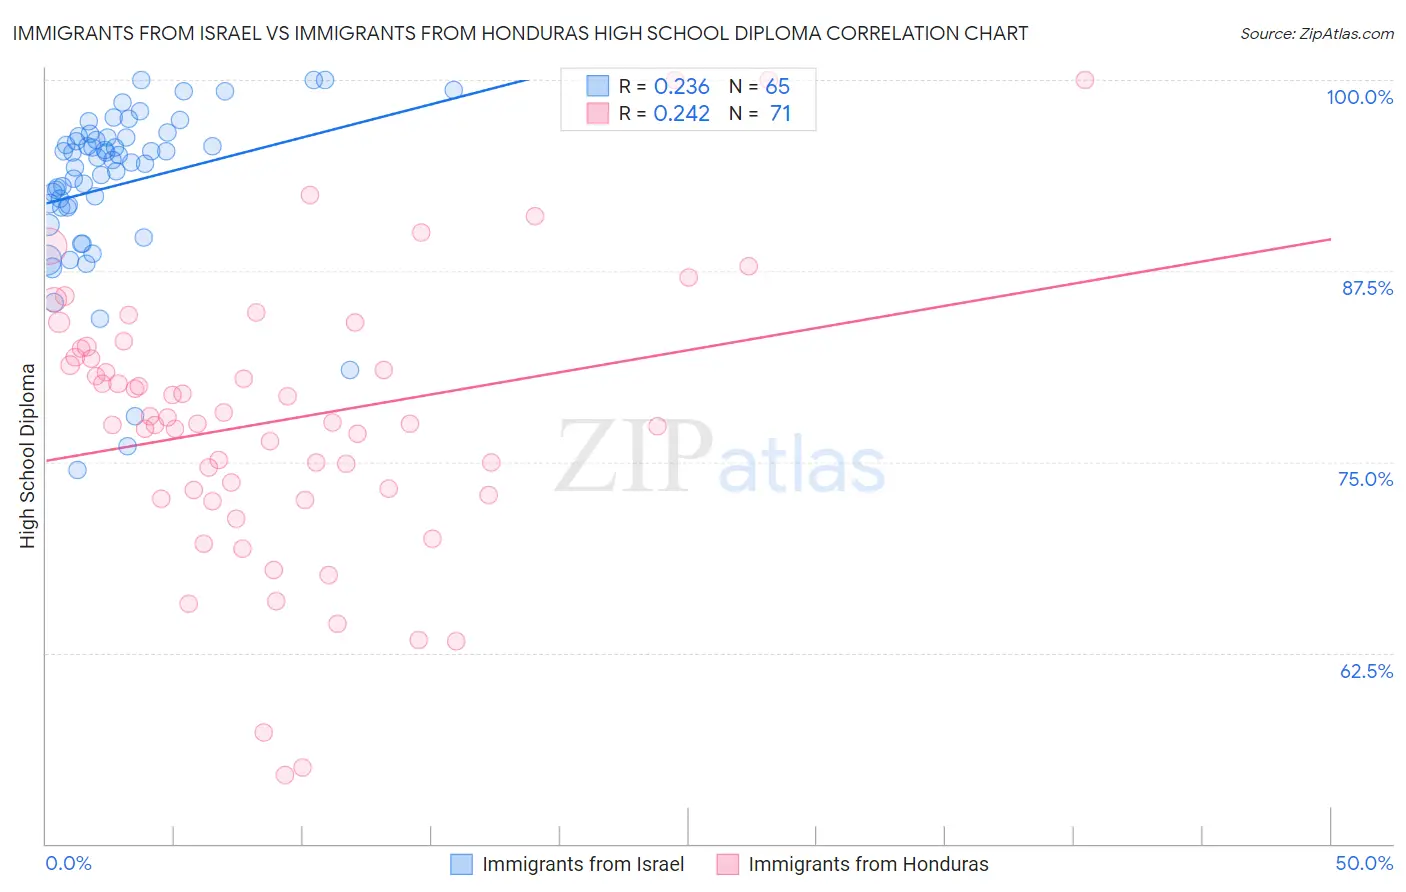
Immigrants from Israel vs Immigrants from Honduras High School Diploma Correlation Chart
The statistical analysis conducted on geographies consisting of 210,029,020 people shows a weak positive correlation between the proportion of Immigrants from Israel and percentage of population with at least high school diploma education in the United States with a correlation coefficient (R) of 0.236 and weighted average of 90.5%. Similarly, the statistical analysis conducted on geographies consisting of 322,637,368 people shows a weak positive correlation between the proportion of Immigrants from Honduras and percentage of population with at least high school diploma education in the United States with a correlation coefficient (R) of 0.242 and weighted average of 82.5%, a difference of 9.8%.
High School Diploma Correlation Summary
| Measurement | Immigrants from Israel | Immigrants from Honduras |
| Minimum | 74.4% | 54.5% |
| Maximum | 100.0% | 100.0% |
| Range | 25.6% | 45.5% |
| Mean | 93.1% | 77.7% |
| Median | 94.8% | 77.6% |
| Interquartile 25% (IQ1) | 91.7% | 72.8% |
| Interquartile 75% (IQ3) | 96.2% | 82.4% |
| Interquartile Range (IQR) | 4.6% | 9.6% |
| Standard Deviation (Sample) | 5.4% | 9.1% |
| Standard Deviation (Population) | 5.4% | 9.1% |
Similar Demographics by High School Diploma
Demographics Similar to Immigrants from Israel by High School Diploma
In terms of high school diploma, the demographic groups most similar to Immigrants from Israel are Icelander (90.5%, a difference of 0.0%), Immigrants from Serbia (90.5%, a difference of 0.010%), Swiss (90.6%, a difference of 0.020%), Immigrants from Western Europe (90.6%, a difference of 0.020%), and South African (90.6%, a difference of 0.040%).
| Demographics | Rating | Rank | High School Diploma |
| Immigrants | Turkey | 98.9 /100 | #87 | Exceptional 90.6% |
| Immigrants | France | 98.8 /100 | #88 | Exceptional 90.6% |
| Canadians | 98.7 /100 | #89 | Exceptional 90.6% |
| Celtics | 98.7 /100 | #90 | Exceptional 90.6% |
| South Africans | 98.6 /100 | #91 | Exceptional 90.6% |
| Swiss | 98.6 /100 | #92 | Exceptional 90.6% |
| Immigrants | Western Europe | 98.6 /100 | #93 | Exceptional 90.6% |
| Immigrants | Israel | 98.5 /100 | #94 | Exceptional 90.5% |
| Icelanders | 98.5 /100 | #95 | Exceptional 90.5% |
| Immigrants | Serbia | 98.4 /100 | #96 | Exceptional 90.5% |
| Immigrants | Kuwait | 98.3 /100 | #97 | Exceptional 90.5% |
| Immigrants | Korea | 98.3 /100 | #98 | Exceptional 90.5% |
| Immigrants | Europe | 98.2 /100 | #99 | Exceptional 90.5% |
| Immigrants | North Macedonia | 98.1 /100 | #100 | Exceptional 90.5% |
| Immigrants | Norway | 98.0 /100 | #101 | Exceptional 90.5% |
Demographics Similar to Immigrants from Honduras by High School Diploma
In terms of high school diploma, the demographic groups most similar to Immigrants from Honduras are Central American (82.5%, a difference of 0.10%), Immigrants from Latin America (82.1%, a difference of 0.39%), Immigrants from the Azores (82.8%, a difference of 0.41%), Hispanic or Latino (82.9%, a difference of 0.49%), and Tohono O'odham (82.1%, a difference of 0.50%).
| Demographics | Rating | Rank | High School Diploma |
| Immigrants | Nicaragua | 0.0 /100 | #325 | Tragic 83.1% |
| Mexican American Indians | 0.0 /100 | #326 | Tragic 83.0% |
| Hondurans | 0.0 /100 | #327 | Tragic 83.0% |
| Dominicans | 0.0 /100 | #328 | Tragic 82.9% |
| Hispanics or Latinos | 0.0 /100 | #329 | Tragic 82.9% |
| Immigrants | Azores | 0.0 /100 | #330 | Tragic 82.8% |
| Central Americans | 0.0 /100 | #331 | Tragic 82.5% |
| Immigrants | Honduras | 0.0 /100 | #332 | Tragic 82.5% |
| Immigrants | Latin America | 0.0 /100 | #333 | Tragic 82.1% |
| Tohono O'odham | 0.0 /100 | #334 | Tragic 82.1% |
| Guatemalans | 0.0 /100 | #335 | Tragic 82.0% |
| Immigrants | Dominican Republic | 0.0 /100 | #336 | Tragic 82.0% |
| Immigrants | Yemen | 0.0 /100 | #337 | Tragic 81.8% |
| Salvadorans | 0.0 /100 | #338 | Tragic 81.7% |
| Pima | 0.0 /100 | #339 | Tragic 81.6% |