Immigrants from Burma/Myanmar vs Immigrants from Honduras In Labor Force | Age 25-29
COMPARE
Immigrants from Burma/Myanmar
Immigrants from Honduras
In Labor Force | Age 25-29
In Labor Force | Age 25-29 Comparison
Immigrants from Burma/Myanmar
Immigrants from Honduras
84.7%
IN LABOR FORCE | AGE 25-29
57.4/ 100
METRIC RATING
165th/ 347
METRIC RANK
83.3%
IN LABOR FORCE | AGE 25-29
0.0/ 100
METRIC RATING
276th/ 347
METRIC RANK
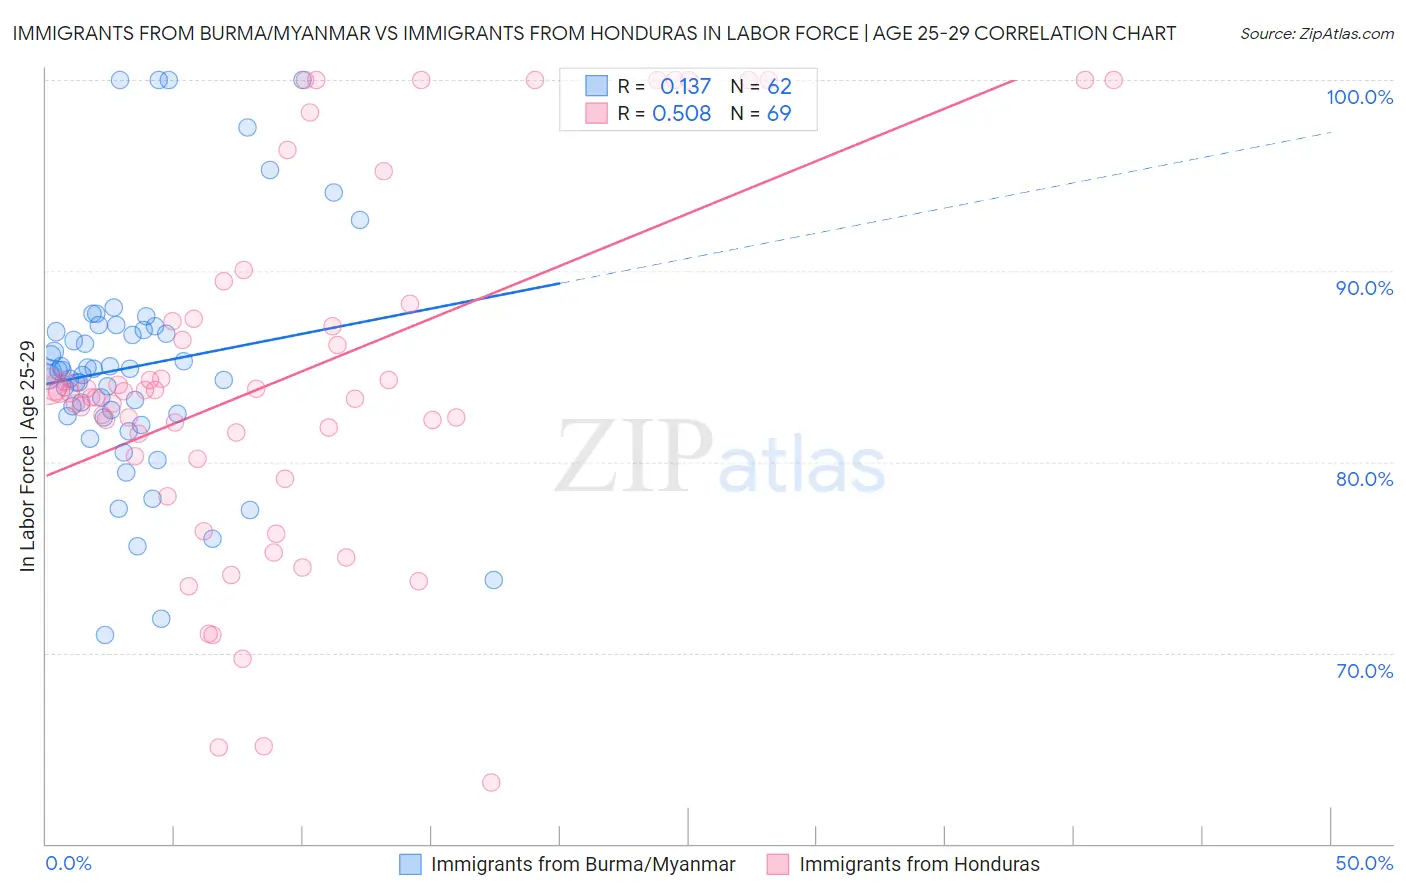
Immigrants from Burma/Myanmar vs Immigrants from Honduras In Labor Force | Age 25-29 Correlation Chart
The statistical analysis conducted on geographies consisting of 172,340,666 people shows a poor positive correlation between the proportion of Immigrants from Burma/Myanmar and labor force participation rate among population between the ages 25 and 29 in the United States with a correlation coefficient (R) of 0.137 and weighted average of 84.7%. Similarly, the statistical analysis conducted on geographies consisting of 322,539,731 people shows a substantial positive correlation between the proportion of Immigrants from Honduras and labor force participation rate among population between the ages 25 and 29 in the United States with a correlation coefficient (R) of 0.508 and weighted average of 83.3%, a difference of 1.7%.
In Labor Force | Age 25-29 Correlation Summary
| Measurement | Immigrants from Burma/Myanmar | Immigrants from Honduras |
| Minimum | 70.9% | 63.2% |
| Maximum | 100.0% | 100.0% |
| Range | 29.1% | 36.8% |
| Mean | 85.0% | 84.4% |
| Median | 84.7% | 83.7% |
| Interquartile 25% (IQ1) | 82.4% | 80.2% |
| Interquartile 75% (IQ3) | 86.9% | 87.9% |
| Interquartile Range (IQR) | 4.5% | 7.7% |
| Standard Deviation (Sample) | 6.2% | 9.3% |
| Standard Deviation (Population) | 6.2% | 9.3% |
Similar Demographics by In Labor Force | Age 25-29
Demographics Similar to Immigrants from Burma/Myanmar by In Labor Force | Age 25-29
In terms of in labor force | age 25-29, the demographic groups most similar to Immigrants from Burma/Myanmar are Argentinean (84.7%, a difference of 0.0%), Ghanaian (84.7%, a difference of 0.0%), Immigrants from Spain (84.7%, a difference of 0.0%), Immigrants from Peru (84.7%, a difference of 0.010%), and Canadian (84.7%, a difference of 0.010%).
| Demographics | Rating | Rank | In Labor Force | Age 25-29 |
| Immigrants | Ghana | 60.2 /100 | #158 | Good 84.7% |
| Immigrants | Western Africa | 60.1 /100 | #159 | Good 84.7% |
| Immigrants | Peru | 58.6 /100 | #160 | Average 84.7% |
| Canadians | 58.5 /100 | #161 | Average 84.7% |
| Immigrants | Colombia | 58.3 /100 | #162 | Average 84.7% |
| Argentineans | 57.9 /100 | #163 | Average 84.7% |
| Ghanaians | 57.6 /100 | #164 | Average 84.7% |
| Immigrants | Burma/Myanmar | 57.4 /100 | #165 | Average 84.7% |
| Immigrants | Spain | 56.9 /100 | #166 | Average 84.7% |
| Indonesians | 56.5 /100 | #167 | Average 84.7% |
| South Americans | 54.9 /100 | #168 | Average 84.7% |
| Celtics | 52.5 /100 | #169 | Average 84.7% |
| Tongans | 52.4 /100 | #170 | Average 84.7% |
| Immigrants | Vietnam | 50.5 /100 | #171 | Average 84.7% |
| Immigrants | Western Europe | 50.4 /100 | #172 | Average 84.7% |
Demographics Similar to Immigrants from Honduras by In Labor Force | Age 25-29
In terms of in labor force | age 25-29, the demographic groups most similar to Immigrants from Honduras are Samoan (83.3%, a difference of 0.0%), Marshallese (83.3%, a difference of 0.050%), Immigrants from Dominica (83.4%, a difference of 0.070%), African (83.2%, a difference of 0.070%), and Immigrants from Caribbean (83.4%, a difference of 0.080%).
| Demographics | Rating | Rank | In Labor Force | Age 25-29 |
| Immigrants | Barbados | 0.0 /100 | #269 | Tragic 83.4% |
| Basques | 0.0 /100 | #270 | Tragic 83.4% |
| Hondurans | 0.0 /100 | #271 | Tragic 83.4% |
| Immigrants | Caribbean | 0.0 /100 | #272 | Tragic 83.4% |
| Immigrants | Dominica | 0.0 /100 | #273 | Tragic 83.4% |
| Marshallese | 0.0 /100 | #274 | Tragic 83.3% |
| Samoans | 0.0 /100 | #275 | Tragic 83.3% |
| Immigrants | Honduras | 0.0 /100 | #276 | Tragic 83.3% |
| Africans | 0.0 /100 | #277 | Tragic 83.2% |
| Immigrants | Cuba | 0.0 /100 | #278 | Tragic 83.2% |
| British West Indians | 0.0 /100 | #279 | Tragic 83.2% |
| Dominicans | 0.0 /100 | #280 | Tragic 83.2% |
| Immigrants | Dominican Republic | 0.0 /100 | #281 | Tragic 83.1% |
| Americans | 0.0 /100 | #282 | Tragic 83.1% |
| Immigrants | Azores | 0.0 /100 | #283 | Tragic 83.1% |