Bermudan vs Immigrants from Czechoslovakia GED/Equivalency
COMPARE
Bermudan
Immigrants from Czechoslovakia
GED/Equivalency
GED/Equivalency Comparison
Bermudans
Immigrants from Czechoslovakia
85.8%
GED/EQUIVALENCY
55.1/ 100
METRIC RATING
172nd/ 347
METRIC RANK
87.9%
GED/EQUIVALENCY
99.3/ 100
METRIC RATING
57th/ 347
METRIC RANK
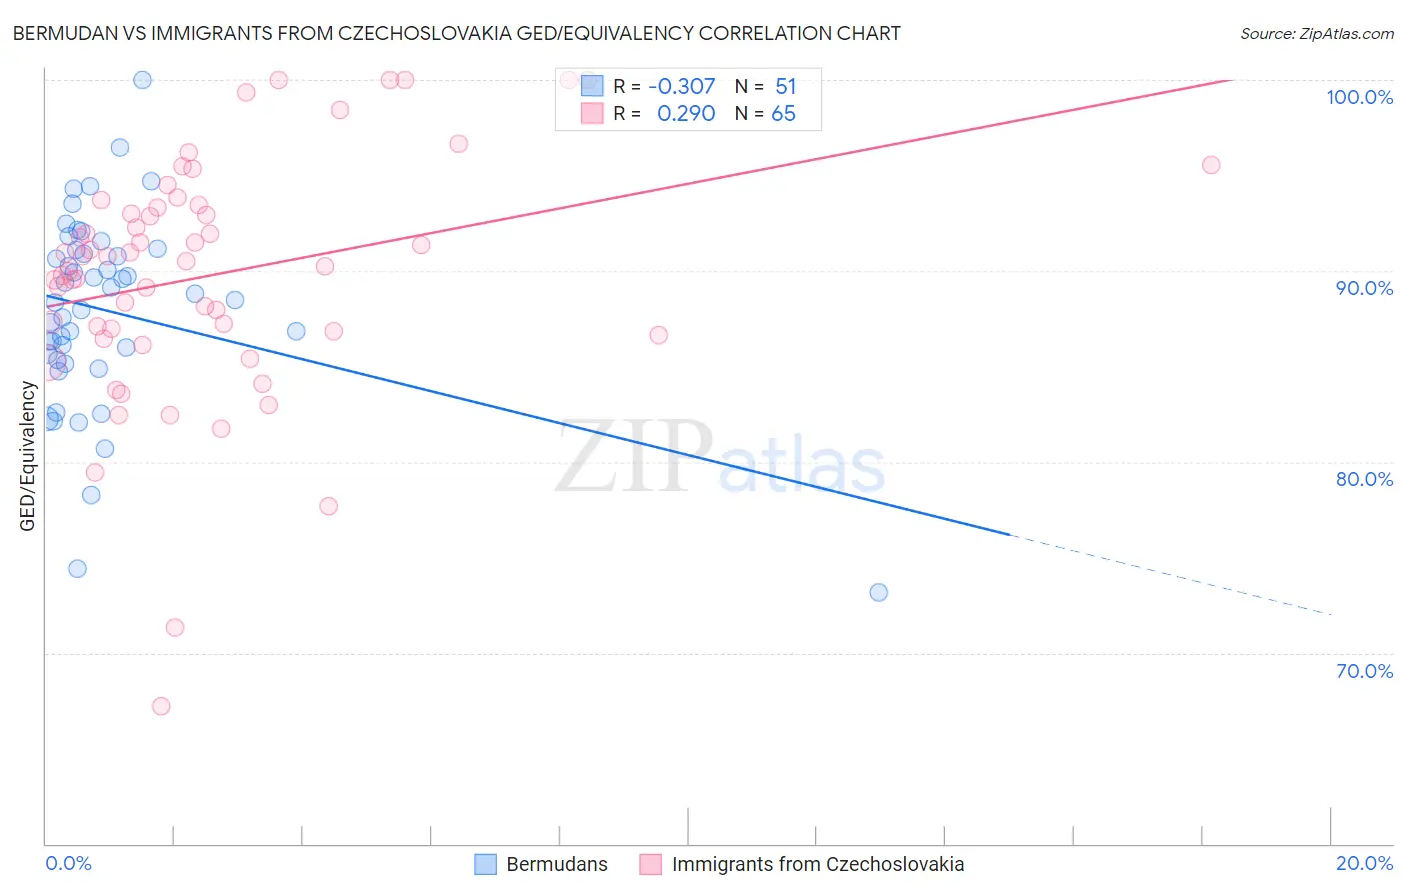
Bermudan vs Immigrants from Czechoslovakia GED/Equivalency Correlation Chart
The statistical analysis conducted on geographies consisting of 55,728,561 people shows a mild negative correlation between the proportion of Bermudans and percentage of population with at least ged/equivalency education in the United States with a correlation coefficient (R) of -0.307 and weighted average of 85.8%. Similarly, the statistical analysis conducted on geographies consisting of 195,448,106 people shows a weak positive correlation between the proportion of Immigrants from Czechoslovakia and percentage of population with at least ged/equivalency education in the United States with a correlation coefficient (R) of 0.290 and weighted average of 87.9%, a difference of 2.4%.
GED/Equivalency Correlation Summary
| Measurement | Bermudan | Immigrants from Czechoslovakia |
| Minimum | 73.2% | 67.2% |
| Maximum | 100.0% | 100.0% |
| Range | 26.8% | 32.8% |
| Mean | 87.9% | 89.8% |
| Median | 88.5% | 90.5% |
| Interquartile 25% (IQ1) | 85.3% | 86.7% |
| Interquartile 75% (IQ3) | 91.1% | 93.4% |
| Interquartile Range (IQR) | 5.8% | 6.6% |
| Standard Deviation (Sample) | 5.1% | 6.3% |
| Standard Deviation (Population) | 5.0% | 6.3% |
Similar Demographics by GED/Equivalency
Demographics Similar to Bermudans by GED/Equivalency
In terms of ged/equivalency, the demographic groups most similar to Bermudans are Immigrants from Chile (85.9%, a difference of 0.050%), Immigrants from Venezuela (85.8%, a difference of 0.090%), Afghan (85.9%, a difference of 0.10%), Ottawa (85.8%, a difference of 0.10%), and Immigrants from Bolivia (85.8%, a difference of 0.11%).
| Demographics | Rating | Rank | GED/Equivalency |
| Alsatians | 64.3 /100 | #165 | Good 86.0% |
| Immigrants | Albania | 64.2 /100 | #166 | Good 86.0% |
| Ethiopians | 63.7 /100 | #167 | Good 86.0% |
| Sierra Leoneans | 61.8 /100 | #168 | Good 86.0% |
| Immigrants | Ethiopia | 61.2 /100 | #169 | Good 86.0% |
| Afghans | 59.7 /100 | #170 | Average 85.9% |
| Immigrants | Chile | 57.3 /100 | #171 | Average 85.9% |
| Bermudans | 55.1 /100 | #172 | Average 85.8% |
| Immigrants | Venezuela | 50.7 /100 | #173 | Average 85.8% |
| Ottawa | 50.0 /100 | #174 | Average 85.8% |
| Immigrants | Bolivia | 49.8 /100 | #175 | Average 85.8% |
| Immigrants | Eastern Africa | 47.7 /100 | #176 | Average 85.7% |
| Immigrants | Uganda | 45.2 /100 | #177 | Average 85.7% |
| Koreans | 41.2 /100 | #178 | Average 85.6% |
| Aleuts | 40.5 /100 | #179 | Average 85.6% |
Demographics Similar to Immigrants from Czechoslovakia by GED/Equivalency
In terms of ged/equivalency, the demographic groups most similar to Immigrants from Czechoslovakia are Northern European (87.9%, a difference of 0.0%), Serbian (87.9%, a difference of 0.010%), Scandinavian (87.9%, a difference of 0.020%), European (87.9%, a difference of 0.020%), and German (87.9%, a difference of 0.040%).
| Demographics | Rating | Rank | GED/Equivalency |
| Immigrants | Korea | 99.5 /100 | #50 | Exceptional 88.1% |
| Immigrants | Netherlands | 99.4 /100 | #51 | Exceptional 88.0% |
| Zimbabweans | 99.4 /100 | #52 | Exceptional 88.0% |
| Immigrants | South Africa | 99.4 /100 | #53 | Exceptional 88.0% |
| Soviet Union | 99.4 /100 | #54 | Exceptional 88.0% |
| New Zealanders | 99.4 /100 | #55 | Exceptional 88.0% |
| Immigrants | Denmark | 99.4 /100 | #56 | Exceptional 88.0% |
| Immigrants | Czechoslovakia | 99.3 /100 | #57 | Exceptional 87.9% |
| Northern Europeans | 99.3 /100 | #58 | Exceptional 87.9% |
| Serbians | 99.3 /100 | #59 | Exceptional 87.9% |
| Scandinavians | 99.3 /100 | #60 | Exceptional 87.9% |
| Europeans | 99.3 /100 | #61 | Exceptional 87.9% |
| Germans | 99.3 /100 | #62 | Exceptional 87.9% |
| Immigrants | Turkey | 99.2 /100 | #63 | Exceptional 87.9% |
| Immigrants | Canada | 99.2 /100 | #64 | Exceptional 87.9% |