Pueblo vs Immigrants from Congo Master's Degree
COMPARE
Pueblo
Immigrants from Congo
Master's Degree
Master's Degree Comparison
Pueblo
Immigrants from Congo
10.3%
MASTER'S DEGREE
0.0/ 100
METRIC RATING
331st/ 347
METRIC RANK
12.6%
MASTER'S DEGREE
0.8/ 100
METRIC RATING
255th/ 347
METRIC RANK
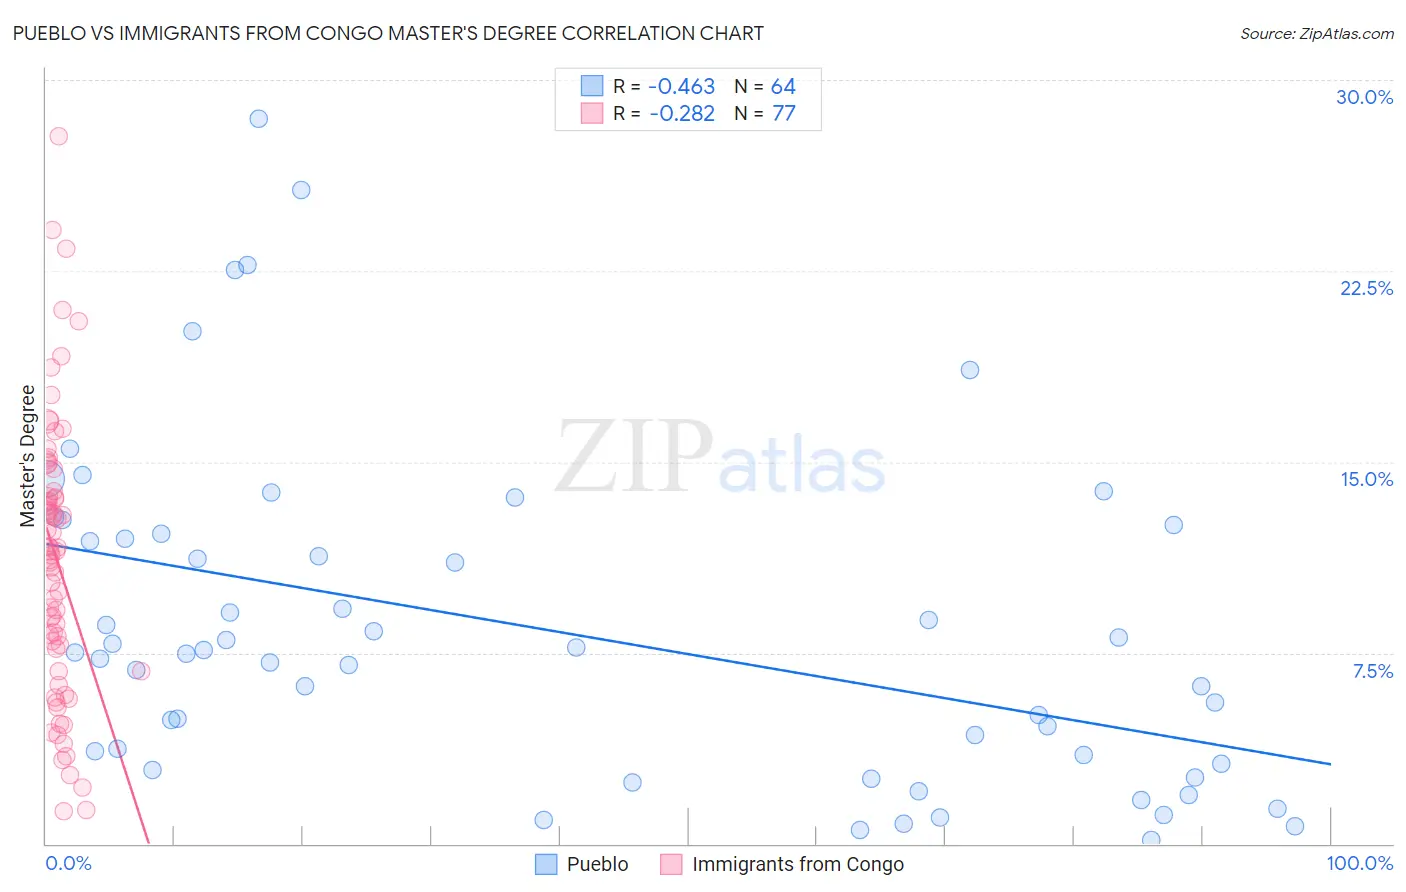
Pueblo vs Immigrants from Congo Master's Degree Correlation Chart
The statistical analysis conducted on geographies consisting of 120,067,726 people shows a moderate negative correlation between the proportion of Pueblo and percentage of population with at least master's degree education in the United States with a correlation coefficient (R) of -0.463 and weighted average of 10.3%. Similarly, the statistical analysis conducted on geographies consisting of 92,118,005 people shows a weak negative correlation between the proportion of Immigrants from Congo and percentage of population with at least master's degree education in the United States with a correlation coefficient (R) of -0.282 and weighted average of 12.6%, a difference of 23.0%.
Master's Degree Correlation Summary
| Measurement | Pueblo | Immigrants from Congo |
| Minimum | 0.12% | 1.3% |
| Maximum | 28.5% | 27.8% |
| Range | 28.3% | 26.5% |
| Mean | 8.4% | 11.1% |
| Median | 7.5% | 11.5% |
| Interquartile 25% (IQ1) | 3.3% | 7.2% |
| Interquartile 75% (IQ3) | 12.1% | 13.7% |
| Interquartile Range (IQR) | 8.8% | 6.5% |
| Standard Deviation (Sample) | 6.4% | 5.4% |
| Standard Deviation (Population) | 6.4% | 5.4% |
Similar Demographics by Master's Degree
Demographics Similar to Pueblo by Master's Degree
In terms of master's degree, the demographic groups most similar to Pueblo are Fijian (10.3%, a difference of 0.16%), Immigrants from the Azores (10.2%, a difference of 0.46%), Menominee (10.2%, a difference of 0.83%), Nepalese (10.5%, a difference of 1.9%), and Bangladeshi (10.5%, a difference of 2.0%).
| Demographics | Rating | Rank | Master's Degree |
| Dutch West Indians | 0.0 /100 | #324 | Tragic 10.6% |
| Inupiat | 0.0 /100 | #325 | Tragic 10.5% |
| Creek | 0.0 /100 | #326 | Tragic 10.5% |
| Paiute | 0.0 /100 | #327 | Tragic 10.5% |
| Bangladeshis | 0.0 /100 | #328 | Tragic 10.5% |
| Nepalese | 0.0 /100 | #329 | Tragic 10.5% |
| Fijians | 0.0 /100 | #330 | Tragic 10.3% |
| Pueblo | 0.0 /100 | #331 | Tragic 10.3% |
| Immigrants | Azores | 0.0 /100 | #332 | Tragic 10.2% |
| Menominee | 0.0 /100 | #333 | Tragic 10.2% |
| Arapaho | 0.0 /100 | #334 | Tragic 10.0% |
| Immigrants | Central America | 0.0 /100 | #335 | Tragic 10.0% |
| Natives/Alaskans | 0.0 /100 | #336 | Tragic 9.9% |
| Mexicans | 0.0 /100 | #337 | Tragic 9.7% |
| Tohono O'odham | 0.0 /100 | #338 | Tragic 9.7% |
Demographics Similar to Immigrants from Congo by Master's Degree
In terms of master's degree, the demographic groups most similar to Immigrants from Congo are Indonesian (12.6%, a difference of 0.030%), Immigrants from Dominica (12.6%, a difference of 0.070%), Immigrants from Portugal (12.6%, a difference of 0.080%), Osage (12.6%, a difference of 0.55%), and French American Indian (12.7%, a difference of 0.61%).
| Demographics | Rating | Rank | Master's Degree |
| Africans | 1.4 /100 | #248 | Tragic 12.9% |
| Cree | 1.3 /100 | #249 | Tragic 12.8% |
| Liberians | 1.3 /100 | #250 | Tragic 12.8% |
| Tlingit-Haida | 1.3 /100 | #251 | Tragic 12.8% |
| French American Indians | 1.0 /100 | #252 | Tragic 12.7% |
| Immigrants | Dominica | 0.8 /100 | #253 | Tragic 12.6% |
| Indonesians | 0.8 /100 | #254 | Tragic 12.6% |
| Immigrants | Congo | 0.8 /100 | #255 | Tragic 12.6% |
| Immigrants | Portugal | 0.8 /100 | #256 | Tragic 12.6% |
| Osage | 0.7 /100 | #257 | Tragic 12.6% |
| Immigrants | Liberia | 0.6 /100 | #258 | Tragic 12.5% |
| Japanese | 0.6 /100 | #259 | Tragic 12.5% |
| Dominicans | 0.6 /100 | #260 | Tragic 12.5% |
| Tongans | 0.6 /100 | #261 | Tragic 12.5% |
| Nicaraguans | 0.6 /100 | #262 | Tragic 12.5% |