Immigrants from Oceania vs Immigrants from Congo Master's Degree
COMPARE
Immigrants from Oceania
Immigrants from Congo
Master's Degree
Master's Degree Comparison
Immigrants from Oceania
Immigrants from Congo
14.7%
MASTER'S DEGREE
37.1/ 100
METRIC RATING
186th/ 347
METRIC RANK
12.6%
MASTER'S DEGREE
0.8/ 100
METRIC RATING
255th/ 347
METRIC RANK
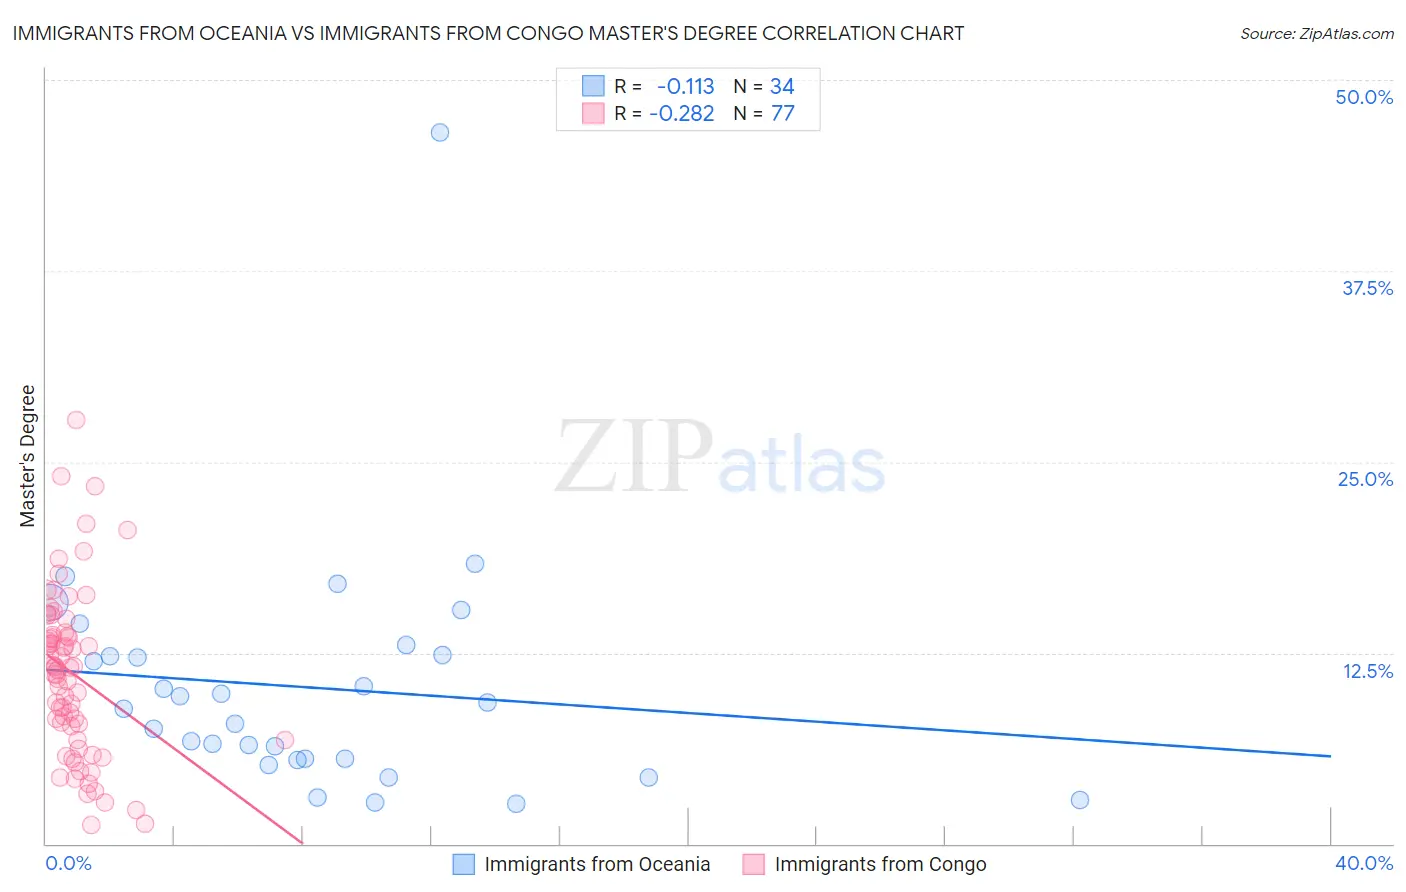
Immigrants from Oceania vs Immigrants from Congo Master's Degree Correlation Chart
The statistical analysis conducted on geographies consisting of 305,448,765 people shows a poor negative correlation between the proportion of Immigrants from Oceania and percentage of population with at least master's degree education in the United States with a correlation coefficient (R) of -0.113 and weighted average of 14.7%. Similarly, the statistical analysis conducted on geographies consisting of 92,118,005 people shows a weak negative correlation between the proportion of Immigrants from Congo and percentage of population with at least master's degree education in the United States with a correlation coefficient (R) of -0.282 and weighted average of 12.6%, a difference of 16.1%.
Master's Degree Correlation Summary
| Measurement | Immigrants from Oceania | Immigrants from Congo |
| Minimum | 2.6% | 1.3% |
| Maximum | 46.6% | 27.8% |
| Range | 44.0% | 26.5% |
| Mean | 10.2% | 11.1% |
| Median | 9.0% | 11.5% |
| Interquartile 25% (IQ1) | 5.6% | 7.2% |
| Interquartile 75% (IQ3) | 12.3% | 13.7% |
| Interquartile Range (IQR) | 6.8% | 6.5% |
| Standard Deviation (Sample) | 7.9% | 5.4% |
| Standard Deviation (Population) | 7.7% | 5.4% |
Similar Demographics by Master's Degree
Demographics Similar to Immigrants from Oceania by Master's Degree
In terms of master's degree, the demographic groups most similar to Immigrants from Oceania are Basque (14.7%, a difference of 0.080%), Immigrants from Costa Rica (14.7%, a difference of 0.12%), Barbadian (14.7%, a difference of 0.16%), Immigrants (14.6%, a difference of 0.16%), and Spaniard (14.6%, a difference of 0.19%).
| Demographics | Rating | Rank | Master's Degree |
| Immigrants | Iraq | 41.3 /100 | #179 | Average 14.8% |
| Celtics | 41.3 /100 | #180 | Average 14.8% |
| Swiss | 41.1 /100 | #181 | Average 14.7% |
| Czechs | 40.4 /100 | #182 | Average 14.7% |
| Sri Lankans | 39.6 /100 | #183 | Fair 14.7% |
| Immigrants | Zaire | 39.5 /100 | #184 | Fair 14.7% |
| Barbadians | 38.3 /100 | #185 | Fair 14.7% |
| Immigrants | Oceania | 37.1 /100 | #186 | Fair 14.7% |
| Basques | 36.5 /100 | #187 | Fair 14.7% |
| Immigrants | Costa Rica | 36.2 /100 | #188 | Fair 14.7% |
| Immigrants | Immigrants | 36.0 /100 | #189 | Fair 14.6% |
| Spaniards | 35.8 /100 | #190 | Fair 14.6% |
| Welsh | 34.2 /100 | #191 | Fair 14.6% |
| Immigrants | Middle Africa | 33.6 /100 | #192 | Fair 14.6% |
| Immigrants | Nigeria | 32.7 /100 | #193 | Fair 14.6% |
Demographics Similar to Immigrants from Congo by Master's Degree
In terms of master's degree, the demographic groups most similar to Immigrants from Congo are Indonesian (12.6%, a difference of 0.030%), Immigrants from Dominica (12.6%, a difference of 0.070%), Immigrants from Portugal (12.6%, a difference of 0.080%), Osage (12.6%, a difference of 0.55%), and French American Indian (12.7%, a difference of 0.61%).
| Demographics | Rating | Rank | Master's Degree |
| Africans | 1.4 /100 | #248 | Tragic 12.9% |
| Cree | 1.3 /100 | #249 | Tragic 12.8% |
| Liberians | 1.3 /100 | #250 | Tragic 12.8% |
| Tlingit-Haida | 1.3 /100 | #251 | Tragic 12.8% |
| French American Indians | 1.0 /100 | #252 | Tragic 12.7% |
| Immigrants | Dominica | 0.8 /100 | #253 | Tragic 12.6% |
| Indonesians | 0.8 /100 | #254 | Tragic 12.6% |
| Immigrants | Congo | 0.8 /100 | #255 | Tragic 12.6% |
| Immigrants | Portugal | 0.8 /100 | #256 | Tragic 12.6% |
| Osage | 0.7 /100 | #257 | Tragic 12.6% |
| Immigrants | Liberia | 0.6 /100 | #258 | Tragic 12.5% |
| Japanese | 0.6 /100 | #259 | Tragic 12.5% |
| Dominicans | 0.6 /100 | #260 | Tragic 12.5% |
| Tongans | 0.6 /100 | #261 | Tragic 12.5% |
| Nicaraguans | 0.6 /100 | #262 | Tragic 12.5% |