Immigrants from Jamaica vs Immigrants from Congo Master's Degree
COMPARE
Immigrants from Jamaica
Immigrants from Congo
Master's Degree
Master's Degree Comparison
Immigrants from Jamaica
Immigrants from Congo
13.0%
MASTER'S DEGREE
1.9/ 100
METRIC RATING
243rd/ 347
METRIC RANK
12.6%
MASTER'S DEGREE
0.8/ 100
METRIC RATING
255th/ 347
METRIC RANK
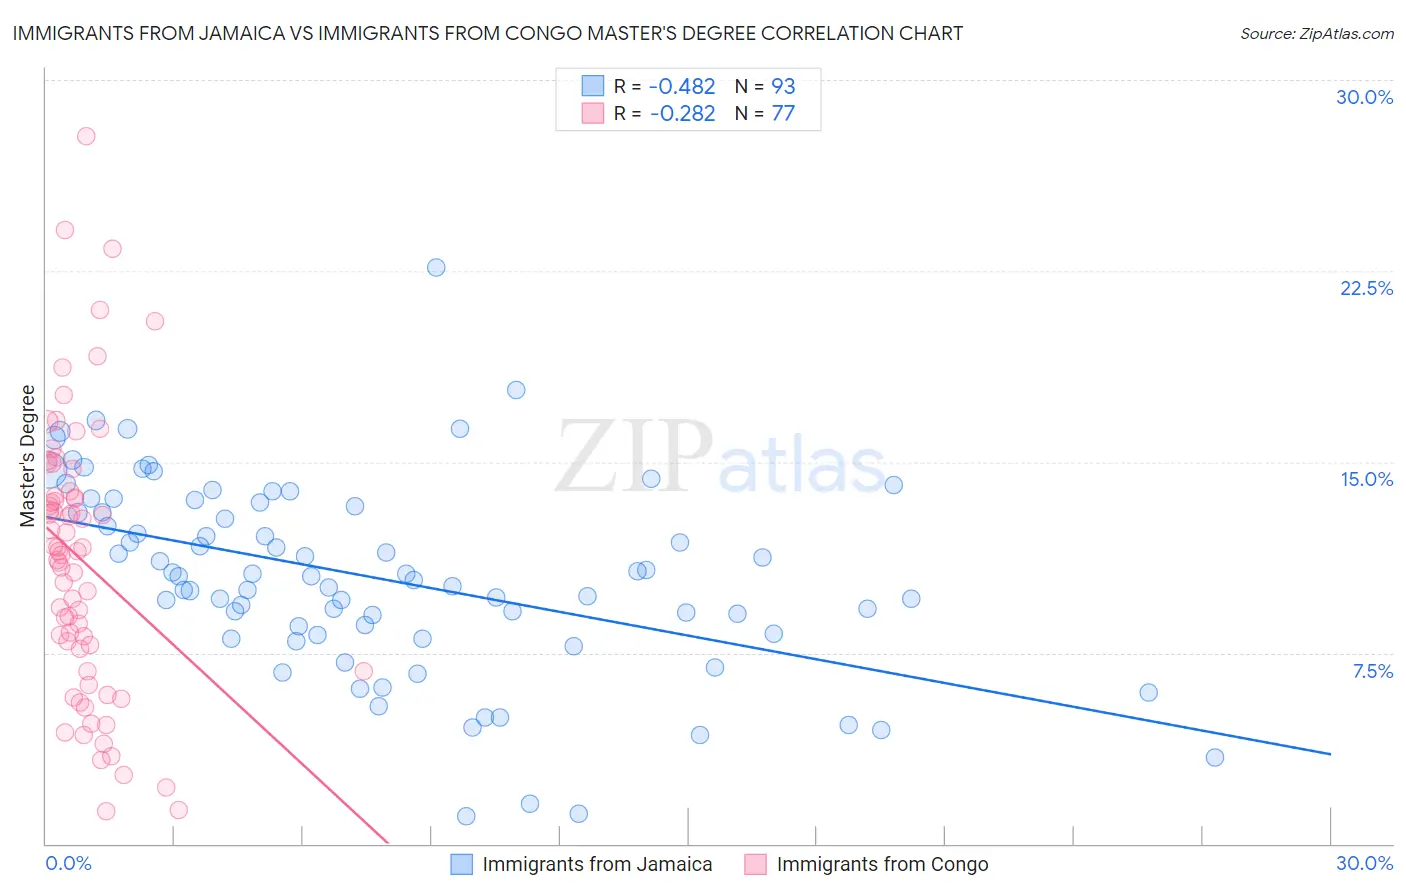
Immigrants from Jamaica vs Immigrants from Congo Master's Degree Correlation Chart
The statistical analysis conducted on geographies consisting of 301,740,066 people shows a moderate negative correlation between the proportion of Immigrants from Jamaica and percentage of population with at least master's degree education in the United States with a correlation coefficient (R) of -0.482 and weighted average of 13.0%. Similarly, the statistical analysis conducted on geographies consisting of 92,118,005 people shows a weak negative correlation between the proportion of Immigrants from Congo and percentage of population with at least master's degree education in the United States with a correlation coefficient (R) of -0.282 and weighted average of 12.6%, a difference of 3.2%.
Master's Degree Correlation Summary
| Measurement | Immigrants from Jamaica | Immigrants from Congo |
| Minimum | 1.1% | 1.3% |
| Maximum | 22.6% | 27.8% |
| Range | 21.5% | 26.5% |
| Mean | 10.4% | 11.1% |
| Median | 10.5% | 11.5% |
| Interquartile 25% (IQ1) | 8.2% | 7.2% |
| Interquartile 75% (IQ3) | 13.3% | 13.7% |
| Interquartile Range (IQR) | 5.1% | 6.5% |
| Standard Deviation (Sample) | 3.8% | 5.4% |
| Standard Deviation (Population) | 3.8% | 5.4% |
Demographics Similar to Immigrants from Jamaica and Immigrants from Congo by Master's Degree
In terms of master's degree, the demographic groups most similar to Immigrants from Jamaica are Spanish American (13.0%, a difference of 0.040%), U.S. Virgin Islander (13.1%, a difference of 0.32%), Delaware (13.0%, a difference of 0.38%), Guamanian/Chamorro (13.1%, a difference of 0.47%), and Immigrants from Bahamas (12.9%, a difference of 1.0%). Similarly, the demographic groups most similar to Immigrants from Congo are Indonesian (12.6%, a difference of 0.030%), Immigrants from Dominica (12.6%, a difference of 0.070%), Immigrants from Portugal (12.6%, a difference of 0.080%), Osage (12.6%, a difference of 0.55%), and French American Indian (12.7%, a difference of 0.61%).
| Demographics | Rating | Rank | Master's Degree |
| Immigrants | Nonimmigrants | 3.4 /100 | #239 | Tragic 13.3% |
| Guamanians/Chamorros | 2.2 /100 | #240 | Tragic 13.1% |
| U.S. Virgin Islanders | 2.1 /100 | #241 | Tragic 13.1% |
| Spanish Americans | 1.9 /100 | #242 | Tragic 13.0% |
| Immigrants | Jamaica | 1.9 /100 | #243 | Tragic 13.0% |
| Delaware | 1.7 /100 | #244 | Tragic 13.0% |
| Immigrants | Bahamas | 1.4 /100 | #245 | Tragic 12.9% |
| Immigrants | Cambodia | 1.4 /100 | #246 | Tragic 12.9% |
| Iroquois | 1.4 /100 | #247 | Tragic 12.9% |
| Africans | 1.4 /100 | #248 | Tragic 12.9% |
| Cree | 1.3 /100 | #249 | Tragic 12.8% |
| Liberians | 1.3 /100 | #250 | Tragic 12.8% |
| Tlingit-Haida | 1.3 /100 | #251 | Tragic 12.8% |
| French American Indians | 1.0 /100 | #252 | Tragic 12.7% |
| Immigrants | Dominica | 0.8 /100 | #253 | Tragic 12.6% |
| Indonesians | 0.8 /100 | #254 | Tragic 12.6% |
| Immigrants | Congo | 0.8 /100 | #255 | Tragic 12.6% |
| Immigrants | Portugal | 0.8 /100 | #256 | Tragic 12.6% |
| Osage | 0.7 /100 | #257 | Tragic 12.6% |
| Immigrants | Liberia | 0.6 /100 | #258 | Tragic 12.5% |
| Japanese | 0.6 /100 | #259 | Tragic 12.5% |