Immigrants from Burma/Myanmar vs Cypriot Master's Degree
COMPARE
Immigrants from Burma/Myanmar
Cypriot
Master's Degree
Master's Degree Comparison
Immigrants from Burma/Myanmar
Cypriots
13.5%
MASTER'S DEGREE
5.0/ 100
METRIC RATING
234th/ 347
METRIC RANK
21.8%
MASTER'S DEGREE
100.0/ 100
METRIC RATING
8th/ 347
METRIC RANK
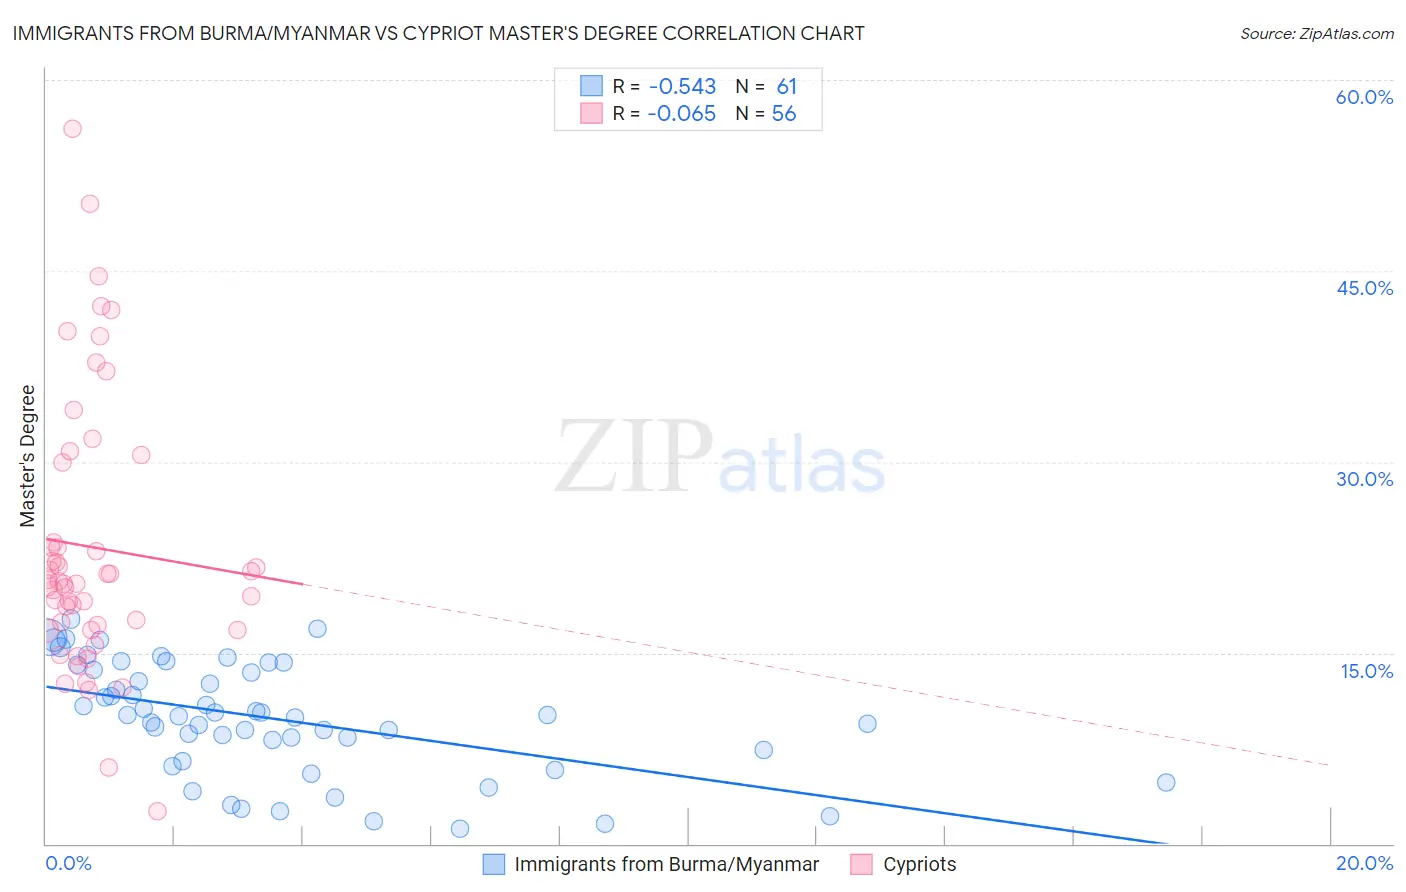
Immigrants from Burma/Myanmar vs Cypriot Master's Degree Correlation Chart
The statistical analysis conducted on geographies consisting of 172,302,674 people shows a substantial negative correlation between the proportion of Immigrants from Burma/Myanmar and percentage of population with at least master's degree education in the United States with a correlation coefficient (R) of -0.543 and weighted average of 13.5%. Similarly, the statistical analysis conducted on geographies consisting of 61,862,826 people shows a slight negative correlation between the proportion of Cypriots and percentage of population with at least master's degree education in the United States with a correlation coefficient (R) of -0.065 and weighted average of 21.8%, a difference of 61.2%.
Master's Degree Correlation Summary
| Measurement | Immigrants from Burma/Myanmar | Cypriot |
| Minimum | 1.2% | 2.5% |
| Maximum | 17.6% | 56.1% |
| Range | 16.5% | 53.6% |
| Mean | 9.9% | 23.3% |
| Median | 10.1% | 20.5% |
| Interquartile 25% (IQ1) | 6.9% | 17.0% |
| Interquartile 75% (IQ3) | 13.9% | 26.8% |
| Interquartile Range (IQR) | 7.0% | 9.8% |
| Standard Deviation (Sample) | 4.4% | 10.7% |
| Standard Deviation (Population) | 4.3% | 10.6% |
Similar Demographics by Master's Degree
Demographics Similar to Immigrants from Burma/Myanmar by Master's Degree
In terms of master's degree, the demographic groups most similar to Immigrants from Burma/Myanmar are German Russian (13.5%, a difference of 0.41%), Immigrants from Ecuador (13.6%, a difference of 0.50%), Immigrants from Guyana (13.4%, a difference of 0.52%), Immigrants from Philippines (13.6%, a difference of 0.65%), and Jamaican (13.4%, a difference of 0.75%).
| Demographics | Rating | Rank | Master's Degree |
| Immigrants | West Indies | 9.8 /100 | #227 | Tragic 13.9% |
| Whites/Caucasians | 9.1 /100 | #228 | Tragic 13.8% |
| British West Indians | 8.8 /100 | #229 | Tragic 13.8% |
| Dutch | 8.7 /100 | #230 | Tragic 13.8% |
| Guyanese | 7.6 /100 | #231 | Tragic 13.7% |
| Immigrants | Philippines | 6.0 /100 | #232 | Tragic 13.6% |
| Immigrants | Ecuador | 5.7 /100 | #233 | Tragic 13.6% |
| Immigrants | Burma/Myanmar | 5.0 /100 | #234 | Tragic 13.5% |
| German Russians | 4.5 /100 | #235 | Tragic 13.5% |
| Immigrants | Guyana | 4.4 /100 | #236 | Tragic 13.4% |
| Jamaicans | 4.1 /100 | #237 | Tragic 13.4% |
| Hmong | 4.0 /100 | #238 | Tragic 13.4% |
| Immigrants | Nonimmigrants | 3.4 /100 | #239 | Tragic 13.3% |
| Guamanians/Chamorros | 2.2 /100 | #240 | Tragic 13.1% |
| U.S. Virgin Islanders | 2.1 /100 | #241 | Tragic 13.1% |
Demographics Similar to Cypriots by Master's Degree
In terms of master's degree, the demographic groups most similar to Cypriots are Thai (21.7%, a difference of 0.34%), Immigrants from Iran (21.6%, a difference of 0.75%), Iranian (22.3%, a difference of 2.2%), Immigrants from India (22.3%, a difference of 2.4%), and Immigrants from China (21.2%, a difference of 2.9%).
| Demographics | Rating | Rank | Master's Degree |
| Immigrants | Singapore | 100.0 /100 | #1 | Exceptional 23.4% |
| Filipinos | 100.0 /100 | #2 | Exceptional 23.4% |
| Immigrants | Israel | 100.0 /100 | #3 | Exceptional 22.6% |
| Okinawans | 100.0 /100 | #4 | Exceptional 22.6% |
| Immigrants | Taiwan | 100.0 /100 | #5 | Exceptional 22.5% |
| Immigrants | India | 100.0 /100 | #6 | Exceptional 22.3% |
| Iranians | 100.0 /100 | #7 | Exceptional 22.3% |
| Cypriots | 100.0 /100 | #8 | Exceptional 21.8% |
| Thais | 100.0 /100 | #9 | Exceptional 21.7% |
| Immigrants | Iran | 100.0 /100 | #10 | Exceptional 21.6% |
| Immigrants | China | 100.0 /100 | #11 | Exceptional 21.2% |
| Eastern Europeans | 100.0 /100 | #12 | Exceptional 21.1% |
| Immigrants | Australia | 100.0 /100 | #13 | Exceptional 20.9% |
| Immigrants | Switzerland | 100.0 /100 | #14 | Exceptional 20.9% |
| Immigrants | Eastern Asia | 100.0 /100 | #15 | Exceptional 20.8% |