Immigrants from Burma/Myanmar vs Immigrants from Liberia Associate's Degree

COMPARE

Immigrants from Burma/Myanmar
Race
Ancestry
AfghanAfricanAlaska NativeAlaskan AthabascanAlbanianAleutAlsatianAmericanApacheArabArapahoArgentineanArmenianAssyrian/Chaldean/SyriacAustralianAustrianBahamianBangladeshiBarbadianBasqueBelgianBelizeanBermudanBhutaneseBlackfeetBolivianBrazilianBritishBritish West IndianBulgarianBurmeseCajunCambodianCanadianCape VerdeanCarpatho RusynCelticCentral AmericanCentral American IndianCherokeeCheyenneChickasawChileanChineseChippewaChoctawColombianColvilleComancheCosta RicanCreeCreekCroatianCrowCubanCypriotCzechCzechoslovakianDanishDelawareDominicanDutchDutch West IndianEastern EuropeanEcuadorianEgyptianEnglishEstonianEthiopianEuropeanFijianFilipinoFinnishFrenchFrench American IndianFrench CanadianGermanGerman RussianGhanaianGreekGuamanian/ChamorroGuatemalanGuyaneseHaitianHmongHonduranHopiHoumaHungarianIcelanderIndian (Asian)IndonesianInupiatIranianIraqiIrishIroquoisIsraeliItalianJamaicanJapaneseJordanianKenyanKiowaKoreanLaotianLatvianLebaneseLiberianLithuanianLumbeeLuxembourgerMacedonianMalaysianMalteseMarshalleseMenomineeMexicanMexican American IndianMongolianMoroccanNative HawaiianNavajoNepaleseNew ZealanderNicaraguanNigerianNorthern EuropeanNorwegianOkinawanOsageOttawaPaiutePakistaniPalestinianPanamanianParaguayanPennsylvania GermanPeruvianPimaPolishPortuguesePotawatomiPuebloPuerto RicanPuget Sound SalishRomanianRussianSalvadoranSamoanScandinavianScotch-IrishScottishSeminoleSenegaleseSerbianShoshoneSierra LeoneanSiouxSlavicSlovakSloveneSomaliSouth AfricanSouth AmericanSouth American IndianSoviet UnionSpaniardSpanishSpanish AmericanSpanish American IndianSri LankanSubsaharan AfricanSudaneseSwedishSwissSyrianTaiwaneseThaiTlingit-HaidaTohono O'OdhamTonganTrinidadian and TobagonianTsimshianTurkishU.S. Virgin IslanderUgandanUkrainianUruguayanUteVenezuelanVietnameseWelshWest IndianYakamaYaquiYugoslavianYumanYup'ikZimbabwean
Immigration
NonimmigrantsImmigrantsAfghanistanAfricaAlbaniaArgentinaArmeniaAsiaAustraliaAustriaBahamasBangladeshBarbadosBelarusBelgiumBelizeBoliviaBosnia and HerzegovinaBrazilBulgariaBurma/MyanmarCabo VerdeCambodiaCameroonCanadaCaribbeanCentral AmericaChileChinaColombiaCongoCosta RicaCroatiaCubaCzechoslovakiaDenmarkDominicaDominican RepublicEastern AfricaEastern AsiaEastern EuropeEcuadorEgyptEl SalvadorEnglandEritreaEthiopiaEuropeFijiFranceGermanyGhanaGreeceGrenadaGuatemalaGuyanaHaitiHondurasHong KongHungaryIndiaIndonesiaIranIraqIrelandIsraelItalyJamaicaJapanJordanKazakhstanKenyaKoreaKuwaitLaosLatin AmericaLatviaLebanonLithuaniaMalaysiaMexicoMicronesiaMiddle AfricaMoldovaMoroccoNepalNetherlandsNicaraguaNigeriaNorth AmericaNorth MacedoniaNorthern AfricaNorthern EuropeNorwayOceaniaPakistanPanamaPeruPhilippinesPolandPortugalRomaniaRussiaSaudi ArabiaScotlandSenegalSerbiaSierra LeoneSingaporeSomaliaSouth AfricaSouth AmericaSouth Central AsiaSouth Eastern AsiaSouthern EuropeSpainSri LankaSt. Vincent and the GrenadinesSudanSwedenSwitzerlandSyriaTaiwanThailandTrinidad and TobagoTurkeyUgandaUkraineUruguayUzbekistanVenezuelaVietnamWest IndiesWestern AfricaWestern AsiaWestern EuropeYemenZaireZimbabweAzores
Immigrants from Liberia
Race
Ancestry
AfghanAfricanAlaska NativeAlaskan AthabascanAlbanianAleutAlsatianAmericanApacheArabArapahoArgentineanArmenianAssyrian/Chaldean/SyriacAustralianAustrianBahamianBangladeshiBarbadianBasqueBelgianBelizeanBermudanBhutaneseBlackfeetBolivianBrazilianBritishBritish West IndianBulgarianBurmeseCajunCambodianCanadianCape VerdeanCarpatho RusynCelticCentral AmericanCentral American IndianCherokeeCheyenneChickasawChileanChineseChippewaChoctawColombianColvilleComancheCosta RicanCreeCreekCroatianCrowCubanCypriotCzechCzechoslovakianDanishDelawareDominicanDutchDutch West IndianEastern EuropeanEcuadorianEgyptianEnglishEstonianEthiopianEuropeanFijianFilipinoFinnishFrenchFrench American IndianFrench CanadianGermanGerman RussianGhanaianGreekGuamanian/ChamorroGuatemalanGuyaneseHaitianHmongHonduranHopiHoumaHungarianIcelanderIndian (Asian)IndonesianInupiatIranianIraqiIrishIroquoisIsraeliItalianJamaicanJapaneseJordanianKenyanKiowaKoreanLaotianLatvianLebaneseLiberianLithuanianLumbeeLuxembourgerMacedonianMalaysianMalteseMarshalleseMenomineeMexicanMexican American IndianMongolianMoroccanNative HawaiianNavajoNepaleseNew ZealanderNicaraguanNigerianNorthern EuropeanNorwegianOkinawanOsageOttawaPaiutePakistaniPalestinianPanamanianParaguayanPennsylvania GermanPeruvianPimaPolishPortuguesePotawatomiPuebloPuerto RicanPuget Sound SalishRomanianRussianSalvadoranSamoanScandinavianScotch-IrishScottishSeminoleSenegaleseSerbianShoshoneSierra LeoneanSiouxSlavicSlovakSloveneSomaliSouth AfricanSouth AmericanSouth American IndianSoviet UnionSpaniardSpanishSpanish AmericanSpanish American IndianSri LankanSubsaharan AfricanSudaneseSwedishSwissSyrianTaiwaneseThaiTlingit-HaidaTohono O'OdhamTonganTrinidadian and TobagonianTsimshianTurkishU.S. Virgin IslanderUgandanUkrainianUruguayanUteVenezuelanVietnameseWelshWest IndianYakamaYaquiYugoslavianYumanYup'ikZimbabwean
Immigration
NonimmigrantsImmigrantsAfghanistanAfricaAlbaniaArgentinaArmeniaAsiaAustraliaAustriaBahamasBangladeshBarbadosBelarusBelgiumBelizeBoliviaBosnia and HerzegovinaBrazilBulgariaCabo VerdeCambodiaCameroonCanadaCaribbeanCentral AmericaChileChinaColombiaCongoCosta RicaCroatiaCubaCzechoslovakiaDenmarkDominicaDominican RepublicEastern AfricaEastern AsiaEastern EuropeEcuadorEgyptEl SalvadorEnglandEritreaEthiopiaEuropeFijiFranceGermanyGhanaGreeceGrenadaGuatemalaGuyanaHaitiHondurasHong KongHungaryIndiaIndonesiaIranIraqIrelandIsraelItalyJamaicaJapanJordanKazakhstanKenyaKoreaKuwaitLaosLatin AmericaLatviaLebanonLiberiaLithuaniaMalaysiaMexicoMicronesiaMiddle AfricaMoldovaMoroccoNepalNetherlandsNicaraguaNigeriaNorth AmericaNorth MacedoniaNorthern AfricaNorthern EuropeNorwayOceaniaPakistanPanamaPeruPhilippinesPolandPortugalRomaniaRussiaSaudi ArabiaScotlandSenegalSerbiaSierra LeoneSingaporeSomaliaSouth AfricaSouth AmericaSouth Central AsiaSouth Eastern AsiaSouthern EuropeSpainSri LankaSt. Vincent and the GrenadinesSudanSwedenSwitzerlandSyriaTaiwanThailandTrinidad and TobagoTurkeyUgandaUkraineUruguayUzbekistanVenezuelaVietnamWest IndiesWestern AfricaWestern AsiaWestern EuropeYemenZaireZimbabweAzores
Associate's Degree
Income
Poverty
Unemployment
Labor Participation
Family Structure
Vehicle Availability
Education Level
Disability

Associate's Degree Comparison

Immigrants from Burma/Myanmar

Immigrants from Liberia

Tragic
Tragic
43.7%
ASSOCIATE'S DEGREE
4.3/ 100
METRIC RATING
226th/ 347
METRIC RANK
42.3%
ASSOCIATE'S DEGREE
0.9/ 100
METRIC RATING
244th/ 347
METRIC RANK

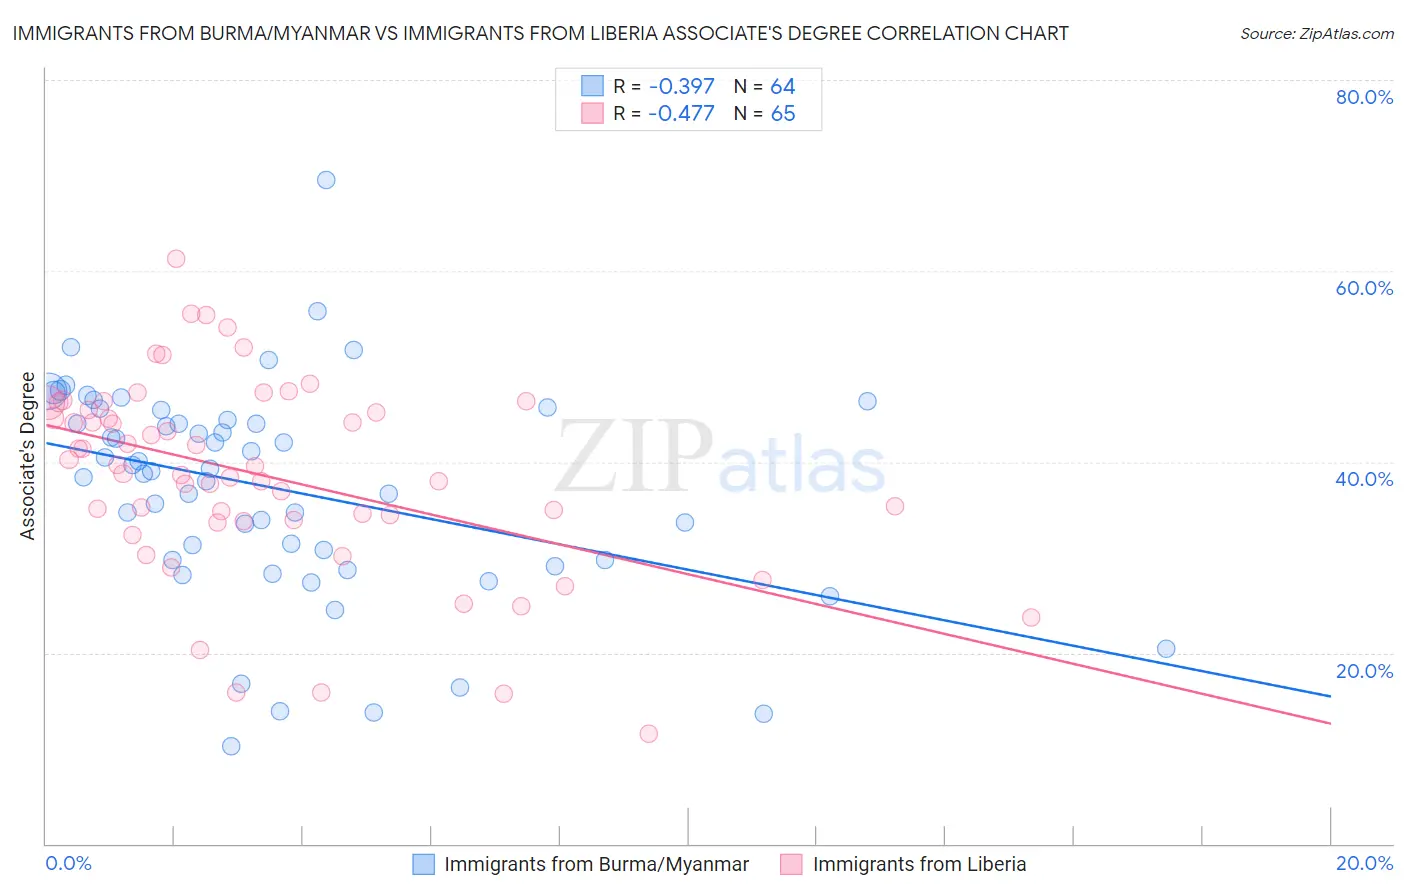
Immigrants from Burma/Myanmar vs Immigrants from Liberia Associate's Degree Correlation Chart

The statistical analysis conducted on geographies consisting of 172,341,560 people shows a mild negative correlation between the proportion of Immigrants from Burma/Myanmar and percentage of population with at least associate's degree education in the United States with a correlation coefficient (R) of -0.397 and weighted average of 43.7%. Similarly, the statistical analysis conducted on geographies consisting of 135,295,697 people shows a moderate negative correlation between the proportion of Immigrants from Liberia and percentage of population with at least associate's degree education in the United States with a correlation coefficient (R) of -0.477 and weighted average of 42.3%, a difference of 3.3%.
Immigrants from Burma/Myanmar vs Immigrants from Liberia Associate's Degree

Associate's Degree Correlation Summary

MeasurementImmigrants from Burma/MyanmarImmigrants from Liberia
Minimum10.2%11.5%
Maximum69.5%61.3%
Range59.3%49.8%
Mean37.2%38.6%
Median39.1%39.5%
Interquartile 25% (IQ1)29.7%33.9%
Interquartile 75% (IQ3)44.9%45.8%
Interquartile Range (IQR)15.2%12.0%
Standard Deviation (Sample)11.3%10.2%
Standard Deviation (Population)11.2%10.2%

Demographics Similar to Immigrants from Burma/Myanmar and Immigrants from Liberia by Associate's Degree

In terms of associate's degree, the demographic groups most similar to Immigrants from Burma/Myanmar are Trinidadian and Tobagonian (43.6%, a difference of 0.17%), Guamanian/Chamorro (43.8%, a difference of 0.22%), Hmong (43.4%, a difference of 0.62%), Immigrants from Trinidad and Tobago (43.3%, a difference of 0.78%), and Immigrants from Barbados (43.3%, a difference of 0.85%). Similarly, the demographic groups most similar to Immigrants from Liberia are Immigrants from Cambodia (42.3%, a difference of 0.020%), Guyanese (42.3%, a difference of 0.14%), Immigrants from West Indies (42.4%, a difference of 0.25%), British West Indian (42.4%, a difference of 0.26%), and Cree (42.5%, a difference of 0.59%).
DemographicsRating | RankAssociate's Degree
Guamanians/Chamorros
4.8
/100
|
#225
Tragic
43.8%
Immigrants | Burma/Myanmar
4.3
/100
|
#226
Tragic
43.7%
Trinidadians and Tobagonians
4.0
/100
|
#227
Tragic
43.6%
Hmong
3.2
/100
|
#228
Tragic
43.4%
Immigrants | Trinidad and Tobago
3.0
/100
|
#229
Tragic
43.3%
Immigrants | Barbados
2.9
/100
|
#230
Tragic
43.3%
Liberians
2.9
/100
|
#231
Tragic
43.3%
Native Hawaiians
2.3
/100
|
#232
Tragic
43.1%
Tongans
2.2
/100
|
#233
Tragic
43.0%
Tlingit-Haida
2.1
/100
|
#234
Tragic
43.0%
Ecuadorians
2.0
/100
|
#235
Tragic
43.0%
Immigrants | St. Vincent and the Grenadines
1.9
/100
|
#236
Tragic
42.9%
Immigrants | Nonimmigrants
1.9
/100
|
#237
Tragic
42.9%
Iroquois
1.7
/100
|
#238
Tragic
42.8%
Immigrants | Grenada
1.3
/100
|
#239
Tragic
42.6%
Cree
1.2
/100
|
#240
Tragic
42.5%
British West Indians
1.0
/100
|
#241
Tragic
42.4%
Immigrants | West Indies
1.0
/100
|
#242
Tragic
42.4%
Guyanese
1.0
/100
|
#243
Tragic
42.3%
Immigrants | Liberia
0.9
/100
|
#244
Tragic
42.3%
Immigrants | Cambodia
0.9
/100
|
#245
Tragic
42.3%