Romanian vs Immigrants from Congo Associate's Degree
COMPARE
Romanian
Immigrants from Congo
Associate's Degree
Associate's Degree Comparison
Romanians
Immigrants from Congo
49.7%
ASSOCIATE'S DEGREE
98.0/ 100
METRIC RATING
96th/ 347
METRIC RANK
41.8%
ASSOCIATE'S DEGREE
0.5/ 100
METRIC RATING
256th/ 347
METRIC RANK
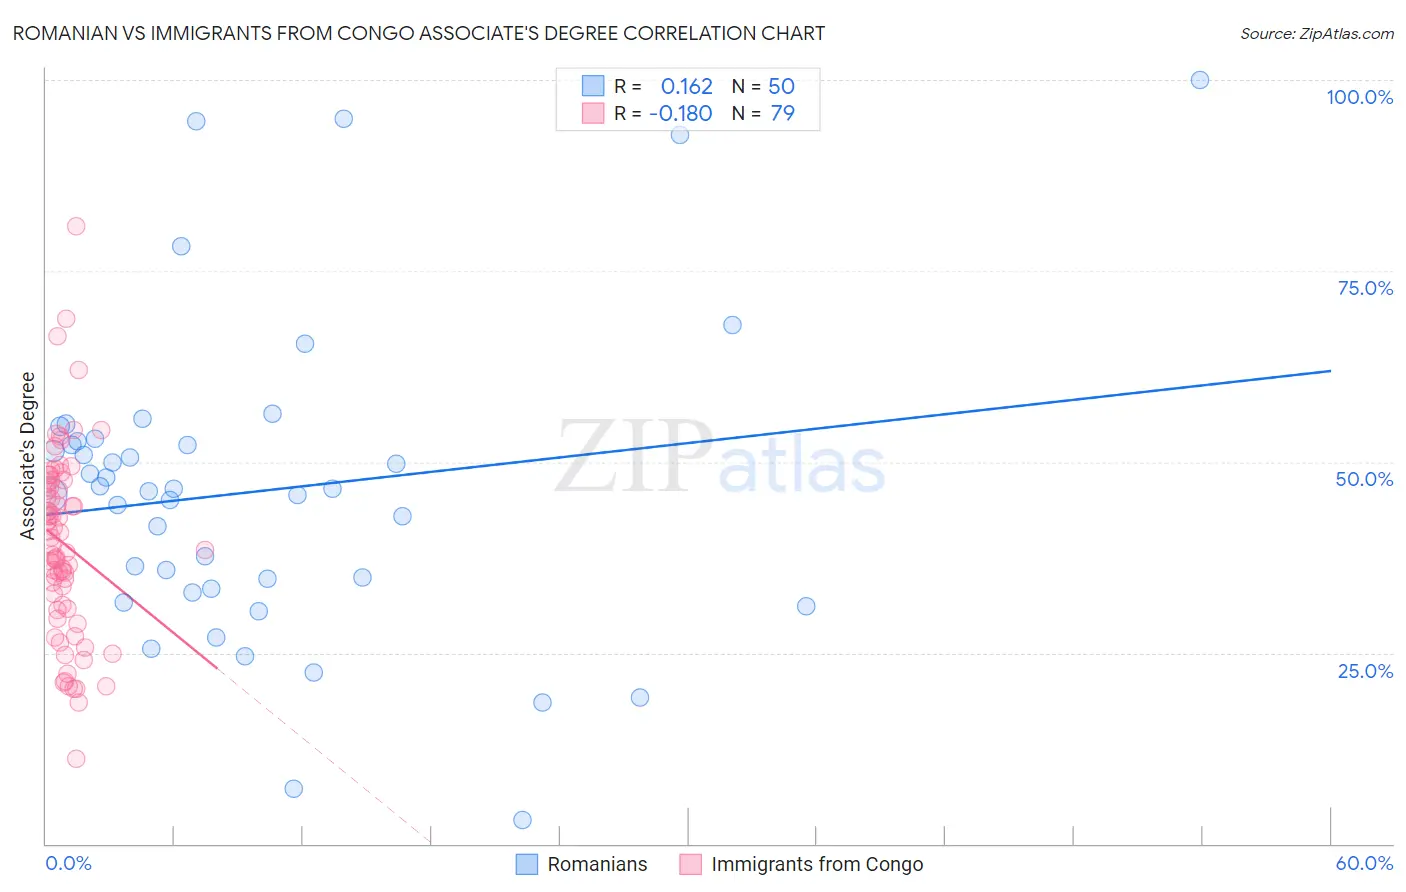
Romanian vs Immigrants from Congo Associate's Degree Correlation Chart
The statistical analysis conducted on geographies consisting of 377,869,565 people shows a poor positive correlation between the proportion of Romanians and percentage of population with at least associate's degree education in the United States with a correlation coefficient (R) of 0.162 and weighted average of 49.7%. Similarly, the statistical analysis conducted on geographies consisting of 92,128,730 people shows a poor negative correlation between the proportion of Immigrants from Congo and percentage of population with at least associate's degree education in the United States with a correlation coefficient (R) of -0.180 and weighted average of 41.8%, a difference of 19.0%.
Associate's Degree Correlation Summary
| Measurement | Romanian | Immigrants from Congo |
| Minimum | 3.1% | 11.1% |
| Maximum | 100.0% | 80.9% |
| Range | 96.9% | 69.7% |
| Mean | 46.2% | 39.3% |
| Median | 46.3% | 39.0% |
| Interquartile 25% (IQ1) | 33.3% | 30.7% |
| Interquartile 75% (IQ3) | 52.7% | 47.3% |
| Interquartile Range (IQR) | 19.4% | 16.6% |
| Standard Deviation (Sample) | 20.5% | 12.3% |
| Standard Deviation (Population) | 20.3% | 12.2% |
Similar Demographics by Associate's Degree
Demographics Similar to Romanians by Associate's Degree
In terms of associate's degree, the demographic groups most similar to Romanians are Immigrants from Ukraine (49.7%, a difference of 0.0%), Immigrants from England (49.7%, a difference of 0.010%), Immigrants from Northern Africa (49.7%, a difference of 0.090%), Macedonian (49.6%, a difference of 0.16%), and Immigrants from Nepal (49.5%, a difference of 0.38%).
| Demographics | Rating | Rank | Associate's Degree |
| Immigrants | Western Europe | 98.7 /100 | #89 | Exceptional 50.1% |
| Immigrants | Ethiopia | 98.7 /100 | #90 | Exceptional 50.1% |
| Immigrants | Western Asia | 98.7 /100 | #91 | Exceptional 50.1% |
| Immigrants | North America | 98.7 /100 | #92 | Exceptional 50.1% |
| Immigrants | Brazil | 98.5 /100 | #93 | Exceptional 50.0% |
| Laotians | 98.4 /100 | #94 | Exceptional 49.9% |
| Immigrants | England | 98.0 /100 | #95 | Exceptional 49.7% |
| Romanians | 98.0 /100 | #96 | Exceptional 49.7% |
| Immigrants | Ukraine | 98.0 /100 | #97 | Exceptional 49.7% |
| Immigrants | Northern Africa | 97.9 /100 | #98 | Exceptional 49.7% |
| Macedonians | 97.8 /100 | #99 | Exceptional 49.6% |
| Immigrants | Nepal | 97.5 /100 | #100 | Exceptional 49.5% |
| Northern Europeans | 97.3 /100 | #101 | Exceptional 49.5% |
| Chileans | 97.3 /100 | #102 | Exceptional 49.4% |
| Ukrainians | 97.1 /100 | #103 | Exceptional 49.4% |
Demographics Similar to Immigrants from Congo by Associate's Degree
In terms of associate's degree, the demographic groups most similar to Immigrants from Congo are Spanish American (41.8%, a difference of 0.060%), Immigrants from Guyana (41.8%, a difference of 0.12%), Cuban (41.9%, a difference of 0.21%), Japanese (41.7%, a difference of 0.27%), and Indonesian (41.9%, a difference of 0.28%).
| Demographics | Rating | Rank | Associate's Degree |
| Jamaicans | 0.7 /100 | #249 | Tragic 42.1% |
| U.S. Virgin Islanders | 0.7 /100 | #250 | Tragic 42.1% |
| Immigrants | Bahamas | 0.7 /100 | #251 | Tragic 42.1% |
| French American Indians | 0.6 /100 | #252 | Tragic 42.0% |
| Indonesians | 0.6 /100 | #253 | Tragic 41.9% |
| Cubans | 0.6 /100 | #254 | Tragic 41.9% |
| Immigrants | Guyana | 0.5 /100 | #255 | Tragic 41.8% |
| Immigrants | Congo | 0.5 /100 | #256 | Tragic 41.8% |
| Spanish Americans | 0.5 /100 | #257 | Tragic 41.8% |
| Japanese | 0.5 /100 | #258 | Tragic 41.7% |
| Malaysians | 0.4 /100 | #259 | Tragic 41.6% |
| Marshallese | 0.4 /100 | #260 | Tragic 41.6% |
| Nicaraguans | 0.4 /100 | #261 | Tragic 41.5% |
| Bahamians | 0.4 /100 | #262 | Tragic 41.5% |
| Immigrants | Jamaica | 0.3 /100 | #263 | Tragic 41.5% |