Immigrants from Burma/Myanmar vs Dominican Associate's Degree
COMPARE
Immigrants from Burma/Myanmar
Dominican
Associate's Degree
Associate's Degree Comparison
Immigrants from Burma/Myanmar
Dominicans
43.7%
ASSOCIATE'S DEGREE
4.3/ 100
METRIC RATING
226th/ 347
METRIC RANK
39.3%
ASSOCIATE'S DEGREE
0.0/ 100
METRIC RATING
291st/ 347
METRIC RANK
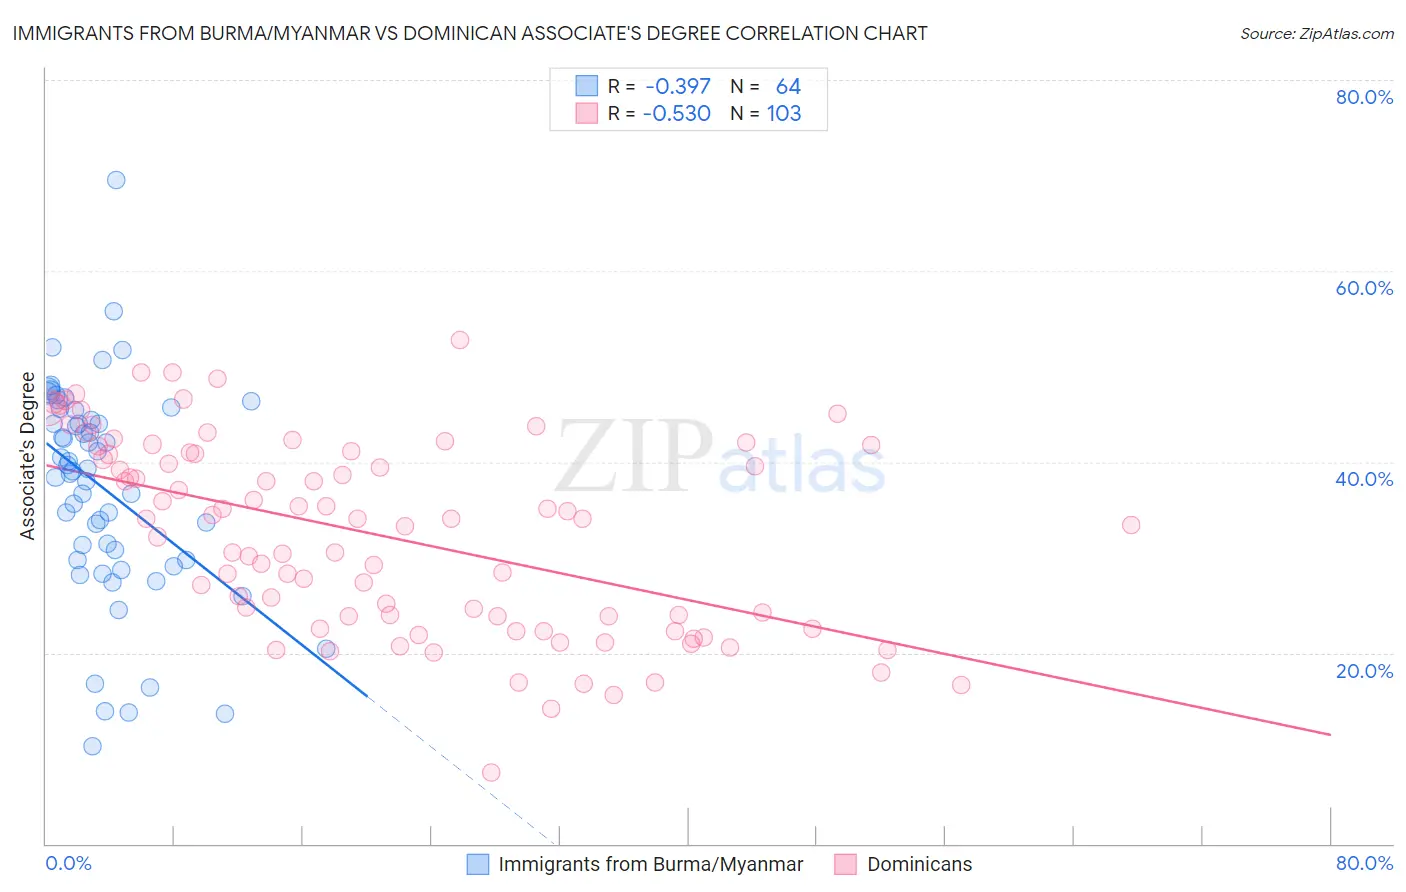
Immigrants from Burma/Myanmar vs Dominican Associate's Degree Correlation Chart
The statistical analysis conducted on geographies consisting of 172,341,560 people shows a mild negative correlation between the proportion of Immigrants from Burma/Myanmar and percentage of population with at least associate's degree education in the United States with a correlation coefficient (R) of -0.397 and weighted average of 43.7%. Similarly, the statistical analysis conducted on geographies consisting of 355,098,353 people shows a substantial negative correlation between the proportion of Dominicans and percentage of population with at least associate's degree education in the United States with a correlation coefficient (R) of -0.530 and weighted average of 39.3%, a difference of 11.2%.
Associate's Degree Correlation Summary
| Measurement | Immigrants from Burma/Myanmar | Dominican |
| Minimum | 10.2% | 7.4% |
| Maximum | 69.5% | 52.8% |
| Range | 59.3% | 45.4% |
| Mean | 37.2% | 32.3% |
| Median | 39.1% | 34.0% |
| Interquartile 25% (IQ1) | 29.7% | 23.8% |
| Interquartile 75% (IQ3) | 44.9% | 41.0% |
| Interquartile Range (IQR) | 15.2% | 17.2% |
| Standard Deviation (Sample) | 11.3% | 10.0% |
| Standard Deviation (Population) | 11.2% | 10.0% |
Similar Demographics by Associate's Degree
Demographics Similar to Immigrants from Burma/Myanmar by Associate's Degree
In terms of associate's degree, the demographic groups most similar to Immigrants from Burma/Myanmar are Trinidadian and Tobagonian (43.6%, a difference of 0.17%), Guamanian/Chamorro (43.8%, a difference of 0.22%), West Indian (43.8%, a difference of 0.37%), Subsaharan African (43.9%, a difference of 0.51%), and Barbadian (43.9%, a difference of 0.61%).
| Demographics | Rating | Rank | Associate's Degree |
| Whites/Caucasians | 7.5 /100 | #219 | Tragic 44.2% |
| Portuguese | 7.2 /100 | #220 | Tragic 44.1% |
| Immigrants | Western Africa | 6.6 /100 | #221 | Tragic 44.1% |
| Barbadians | 5.8 /100 | #222 | Tragic 43.9% |
| Sub-Saharan Africans | 5.5 /100 | #223 | Tragic 43.9% |
| West Indians | 5.2 /100 | #224 | Tragic 43.8% |
| Guamanians/Chamorros | 4.8 /100 | #225 | Tragic 43.8% |
| Immigrants | Burma/Myanmar | 4.3 /100 | #226 | Tragic 43.7% |
| Trinidadians and Tobagonians | 4.0 /100 | #227 | Tragic 43.6% |
| Hmong | 3.2 /100 | #228 | Tragic 43.4% |
| Immigrants | Trinidad and Tobago | 3.0 /100 | #229 | Tragic 43.3% |
| Immigrants | Barbados | 2.9 /100 | #230 | Tragic 43.3% |
| Liberians | 2.9 /100 | #231 | Tragic 43.3% |
| Native Hawaiians | 2.3 /100 | #232 | Tragic 43.1% |
| Tongans | 2.2 /100 | #233 | Tragic 43.0% |
Demographics Similar to Dominicans by Associate's Degree
In terms of associate's degree, the demographic groups most similar to Dominicans are Immigrants from Haiti (39.3%, a difference of 0.010%), Black/African American (39.1%, a difference of 0.29%), Central American (39.4%, a difference of 0.46%), Nepalese (39.0%, a difference of 0.54%), and Salvadoran (39.0%, a difference of 0.54%).
| Demographics | Rating | Rank | Associate's Degree |
| Comanche | 0.1 /100 | #284 | Tragic 39.9% |
| Immigrants | Belize | 0.1 /100 | #285 | Tragic 39.9% |
| Immigrants | Caribbean | 0.0 /100 | #286 | Tragic 39.7% |
| Aleuts | 0.0 /100 | #287 | Tragic 39.6% |
| Immigrants | Cuba | 0.0 /100 | #288 | Tragic 39.5% |
| Central Americans | 0.0 /100 | #289 | Tragic 39.4% |
| Immigrants | Haiti | 0.0 /100 | #290 | Tragic 39.3% |
| Dominicans | 0.0 /100 | #291 | Tragic 39.3% |
| Blacks/African Americans | 0.0 /100 | #292 | Tragic 39.1% |
| Nepalese | 0.0 /100 | #293 | Tragic 39.0% |
| Salvadorans | 0.0 /100 | #294 | Tragic 39.0% |
| Hondurans | 0.0 /100 | #295 | Tragic 38.9% |
| Cherokee | 0.0 /100 | #296 | Tragic 38.9% |
| Cape Verdeans | 0.0 /100 | #297 | Tragic 38.8% |
| Cheyenne | 0.0 /100 | #298 | Tragic 38.7% |