Immigrants from Burma/Myanmar vs Spaniard Associate's Degree
COMPARE
Immigrants from Burma/Myanmar
Spaniard
Associate's Degree
Associate's Degree Comparison
Immigrants from Burma/Myanmar
Spaniards
43.7%
ASSOCIATE'S DEGREE
4.3/ 100
METRIC RATING
226th/ 347
METRIC RANK
45.2%
ASSOCIATE'S DEGREE
20.4/ 100
METRIC RATING
202nd/ 347
METRIC RANK
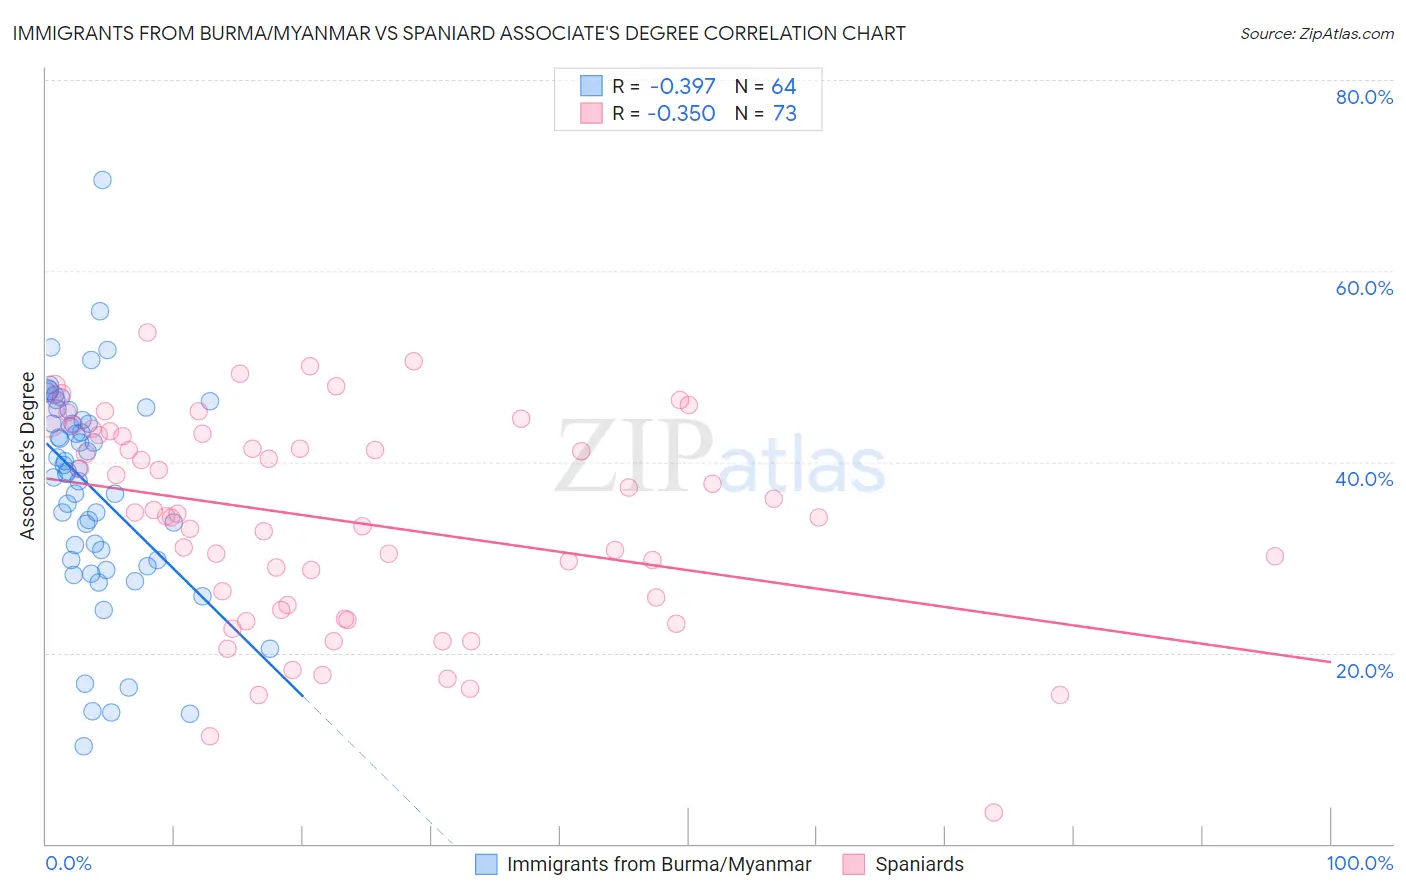
Immigrants from Burma/Myanmar vs Spaniard Associate's Degree Correlation Chart
The statistical analysis conducted on geographies consisting of 172,341,560 people shows a mild negative correlation between the proportion of Immigrants from Burma/Myanmar and percentage of population with at least associate's degree education in the United States with a correlation coefficient (R) of -0.397 and weighted average of 43.7%. Similarly, the statistical analysis conducted on geographies consisting of 443,508,579 people shows a mild negative correlation between the proportion of Spaniards and percentage of population with at least associate's degree education in the United States with a correlation coefficient (R) of -0.350 and weighted average of 45.2%, a difference of 3.4%.
Associate's Degree Correlation Summary
| Measurement | Immigrants from Burma/Myanmar | Spaniard |
| Minimum | 10.2% | 3.3% |
| Maximum | 69.5% | 53.6% |
| Range | 59.3% | 50.2% |
| Mean | 37.2% | 33.8% |
| Median | 39.1% | 34.5% |
| Interquartile 25% (IQ1) | 29.7% | 24.7% |
| Interquartile 75% (IQ3) | 44.9% | 42.8% |
| Interquartile Range (IQR) | 15.2% | 18.1% |
| Standard Deviation (Sample) | 11.3% | 10.9% |
| Standard Deviation (Population) | 11.2% | 10.8% |
Similar Demographics by Associate's Degree
Demographics Similar to Immigrants from Burma/Myanmar by Associate's Degree
In terms of associate's degree, the demographic groups most similar to Immigrants from Burma/Myanmar are Trinidadian and Tobagonian (43.6%, a difference of 0.17%), Guamanian/Chamorro (43.8%, a difference of 0.22%), West Indian (43.8%, a difference of 0.37%), Subsaharan African (43.9%, a difference of 0.51%), and Barbadian (43.9%, a difference of 0.61%).
| Demographics | Rating | Rank | Associate's Degree |
| Whites/Caucasians | 7.5 /100 | #219 | Tragic 44.2% |
| Portuguese | 7.2 /100 | #220 | Tragic 44.1% |
| Immigrants | Western Africa | 6.6 /100 | #221 | Tragic 44.1% |
| Barbadians | 5.8 /100 | #222 | Tragic 43.9% |
| Sub-Saharan Africans | 5.5 /100 | #223 | Tragic 43.9% |
| West Indians | 5.2 /100 | #224 | Tragic 43.8% |
| Guamanians/Chamorros | 4.8 /100 | #225 | Tragic 43.8% |
| Immigrants | Burma/Myanmar | 4.3 /100 | #226 | Tragic 43.7% |
| Trinidadians and Tobagonians | 4.0 /100 | #227 | Tragic 43.6% |
| Hmong | 3.2 /100 | #228 | Tragic 43.4% |
| Immigrants | Trinidad and Tobago | 3.0 /100 | #229 | Tragic 43.3% |
| Immigrants | Barbados | 2.9 /100 | #230 | Tragic 43.3% |
| Liberians | 2.9 /100 | #231 | Tragic 43.3% |
| Native Hawaiians | 2.3 /100 | #232 | Tragic 43.1% |
| Tongans | 2.2 /100 | #233 | Tragic 43.0% |
Demographics Similar to Spaniards by Associate's Degree
In terms of associate's degree, the demographic groups most similar to Spaniards are Immigrants from South Eastern Asia (45.2%, a difference of 0.020%), Immigrants from Vietnam (45.2%, a difference of 0.050%), Senegalese (45.2%, a difference of 0.080%), Immigrants from Senegal (45.2%, a difference of 0.090%), and Immigrants from Bangladesh (45.2%, a difference of 0.11%).
| Demographics | Rating | Rank | Associate's Degree |
| Germans | 26.5 /100 | #195 | Fair 45.5% |
| French | 25.6 /100 | #196 | Fair 45.4% |
| Scotch-Irish | 22.3 /100 | #197 | Fair 45.3% |
| Immigrants | Bangladesh | 21.3 /100 | #198 | Fair 45.2% |
| Immigrants | Senegal | 21.2 /100 | #199 | Fair 45.2% |
| Senegalese | 21.1 /100 | #200 | Fair 45.2% |
| Immigrants | Vietnam | 20.8 /100 | #201 | Fair 45.2% |
| Spaniards | 20.4 /100 | #202 | Fair 45.2% |
| Immigrants | South Eastern Asia | 20.2 /100 | #203 | Fair 45.2% |
| Nigerians | 19.1 /100 | #204 | Poor 45.1% |
| Immigrants | Thailand | 18.9 /100 | #205 | Poor 45.1% |
| German Russians | 18.9 /100 | #206 | Poor 45.1% |
| Panamanians | 18.4 /100 | #207 | Poor 45.1% |
| Dutch | 17.6 /100 | #208 | Poor 45.0% |
| Immigrants | Costa Rica | 16.7 /100 | #209 | Poor 45.0% |