Indian (Asian) vs Immigrants from Argentina High School Diploma
COMPARE
Indian (Asian)
Immigrants from Argentina
High School Diploma
High School Diploma Comparison
Indians (Asian)
Immigrants from Argentina
89.6%
HIGH SCHOOL DIPLOMA
78.8/ 100
METRIC RATING
142nd/ 347
METRIC RANK
89.4%
HIGH SCHOOL DIPLOMA
65.5/ 100
METRIC RATING
156th/ 347
METRIC RANK
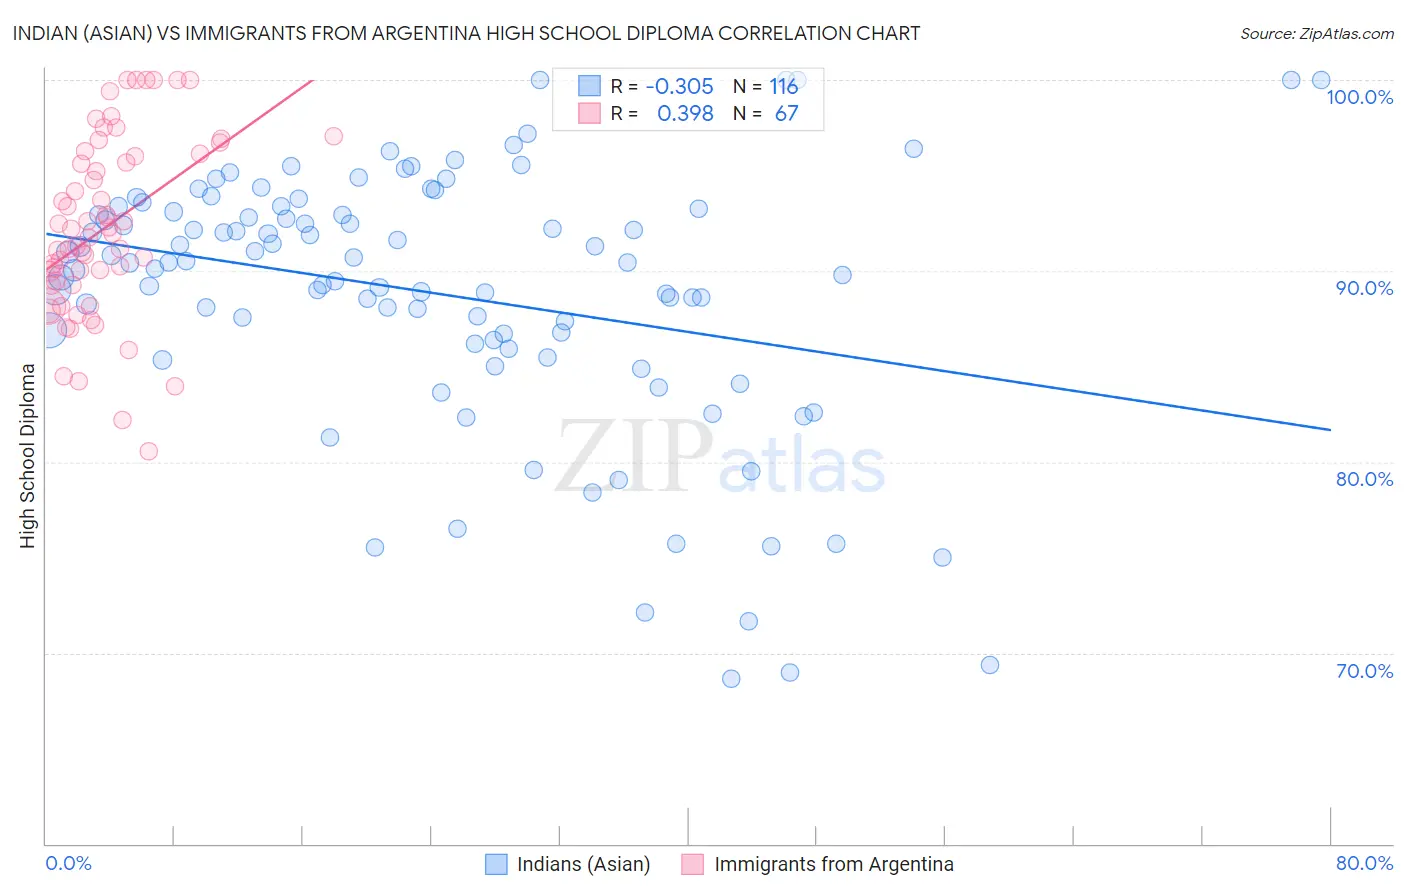
Indian (Asian) vs Immigrants from Argentina High School Diploma Correlation Chart
The statistical analysis conducted on geographies consisting of 495,347,994 people shows a mild negative correlation between the proportion of Indians (Asian) and percentage of population with at least high school diploma education in the United States with a correlation coefficient (R) of -0.305 and weighted average of 89.6%. Similarly, the statistical analysis conducted on geographies consisting of 264,434,241 people shows a mild positive correlation between the proportion of Immigrants from Argentina and percentage of population with at least high school diploma education in the United States with a correlation coefficient (R) of 0.398 and weighted average of 89.4%, a difference of 0.25%.
High School Diploma Correlation Summary
| Measurement | Indian (Asian) | Immigrants from Argentina |
| Minimum | 68.7% | 80.6% |
| Maximum | 100.0% | 100.0% |
| Range | 31.3% | 19.4% |
| Mean | 88.8% | 92.2% |
| Median | 90.4% | 91.9% |
| Interquartile 25% (IQ1) | 86.3% | 89.3% |
| Interquartile 75% (IQ3) | 93.2% | 96.1% |
| Interquartile Range (IQR) | 6.9% | 6.8% |
| Standard Deviation (Sample) | 6.8% | 4.7% |
| Standard Deviation (Population) | 6.8% | 4.6% |
Demographics Similar to Indians (Asian) and Immigrants from Argentina by High School Diploma
In terms of high school diploma, the demographic groups most similar to Indians (Asian) are Chilean (89.6%, a difference of 0.0%), Pakistani (89.6%, a difference of 0.010%), Immigrants from Kenya (89.6%, a difference of 0.020%), Immigrants from Brazil (89.5%, a difference of 0.050%), and Kenyan (89.6%, a difference of 0.060%). Similarly, the demographic groups most similar to Immigrants from Argentina are Alsatian (89.4%, a difference of 0.020%), Immigrants from Northern Africa (89.4%, a difference of 0.020%), Immigrants from Malaysia (89.3%, a difference of 0.030%), Immigrants from Iraq (89.4%, a difference of 0.050%), and Immigrants from Pakistan (89.3%, a difference of 0.050%).
| Demographics | Rating | Rank | High School Diploma |
| Kenyans | 81.4 /100 | #139 | Excellent 89.6% |
| Immigrants | Egypt | 81.2 /100 | #140 | Excellent 89.6% |
| Chileans | 79.0 /100 | #141 | Good 89.6% |
| Indians (Asian) | 78.8 /100 | #142 | Good 89.6% |
| Pakistanis | 78.3 /100 | #143 | Good 89.6% |
| Immigrants | Kenya | 78.0 /100 | #144 | Good 89.6% |
| Immigrants | Brazil | 76.6 /100 | #145 | Good 89.5% |
| Immigrants | Spain | 76.2 /100 | #146 | Good 89.5% |
| Iraqis | 73.9 /100 | #147 | Good 89.5% |
| Immigrants | Lebanon | 73.4 /100 | #148 | Good 89.5% |
| Immigrants | Poland | 72.9 /100 | #149 | Good 89.5% |
| Argentineans | 72.3 /100 | #150 | Good 89.5% |
| Paraguayans | 71.4 /100 | #151 | Good 89.5% |
| Asians | 70.7 /100 | #152 | Good 89.4% |
| Immigrants | Iraq | 68.7 /100 | #153 | Good 89.4% |
| Alsatians | 66.8 /100 | #154 | Good 89.4% |
| Immigrants | Northern Africa | 66.4 /100 | #155 | Good 89.4% |
| Immigrants | Argentina | 65.5 /100 | #156 | Good 89.4% |
| Immigrants | Malaysia | 63.5 /100 | #157 | Good 89.3% |
| Immigrants | Pakistan | 62.5 /100 | #158 | Good 89.3% |
| Immigrants | China | 62.0 /100 | #159 | Good 89.3% |