Ukrainian vs Immigrants from Argentina High School Diploma
COMPARE
Ukrainian
Immigrants from Argentina
High School Diploma
High School Diploma Comparison
Ukrainians
Immigrants from Argentina
91.0%
HIGH SCHOOL DIPLOMA
99.6/ 100
METRIC RATING
64th/ 347
METRIC RANK
89.4%
HIGH SCHOOL DIPLOMA
65.5/ 100
METRIC RATING
156th/ 347
METRIC RANK
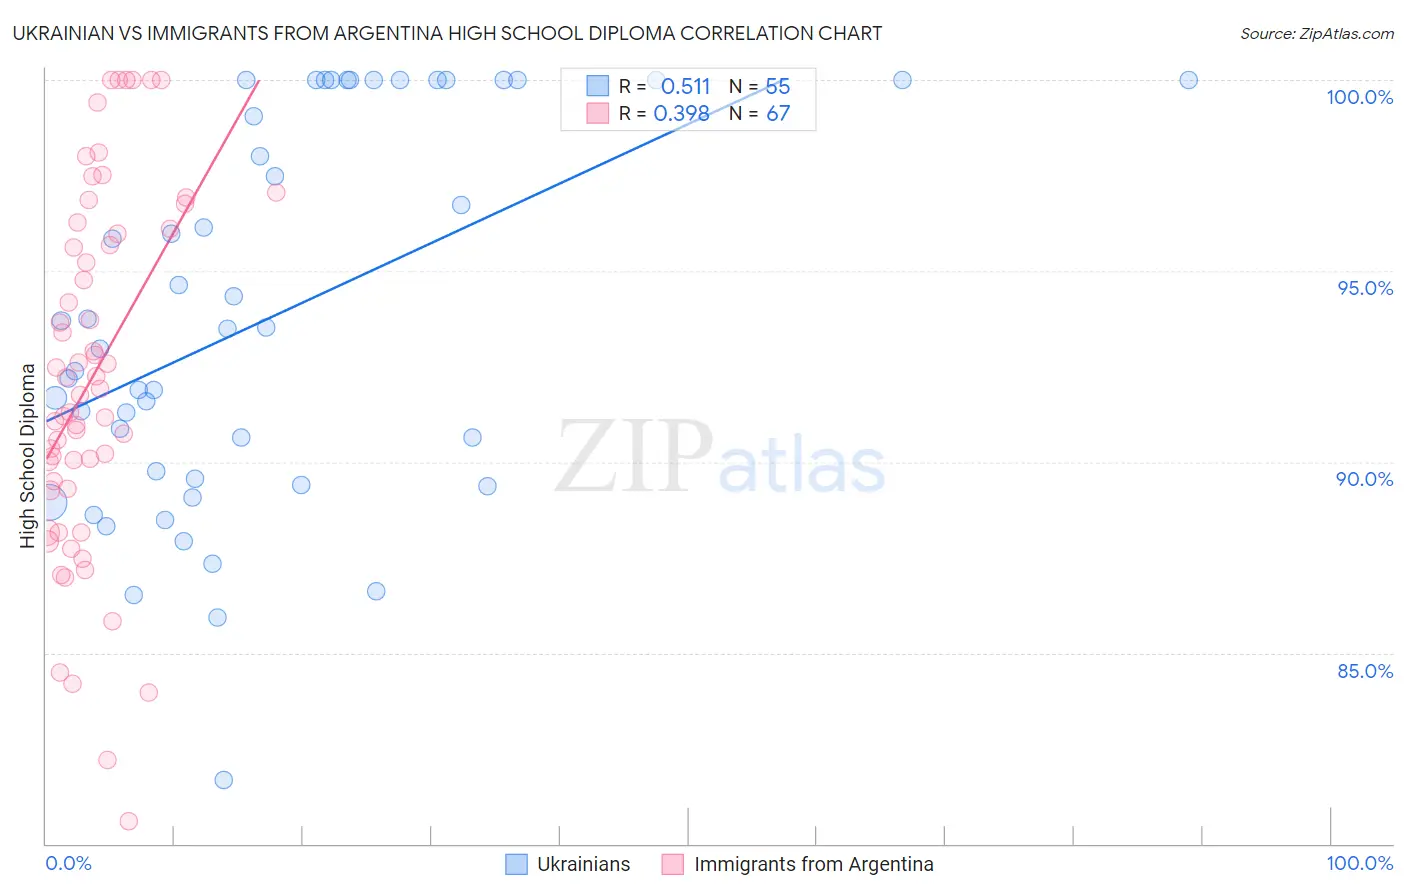
Ukrainian vs Immigrants from Argentina High School Diploma Correlation Chart
The statistical analysis conducted on geographies consisting of 448,696,775 people shows a substantial positive correlation between the proportion of Ukrainians and percentage of population with at least high school diploma education in the United States with a correlation coefficient (R) of 0.511 and weighted average of 91.0%. Similarly, the statistical analysis conducted on geographies consisting of 264,434,241 people shows a mild positive correlation between the proportion of Immigrants from Argentina and percentage of population with at least high school diploma education in the United States with a correlation coefficient (R) of 0.398 and weighted average of 89.4%, a difference of 1.8%.
High School Diploma Correlation Summary
| Measurement | Ukrainian | Immigrants from Argentina |
| Minimum | 81.7% | 80.6% |
| Maximum | 100.0% | 100.0% |
| Range | 18.3% | 19.4% |
| Mean | 93.8% | 92.2% |
| Median | 93.5% | 91.9% |
| Interquartile 25% (IQ1) | 89.6% | 89.3% |
| Interquartile 75% (IQ3) | 100.0% | 96.1% |
| Interquartile Range (IQR) | 10.4% | 6.8% |
| Standard Deviation (Sample) | 4.9% | 4.7% |
| Standard Deviation (Population) | 4.9% | 4.6% |
Similar Demographics by High School Diploma
Demographics Similar to Ukrainians by High School Diploma
In terms of high school diploma, the demographic groups most similar to Ukrainians are Immigrants from South Africa (91.0%, a difference of 0.0%), Immigrants from Netherlands (91.0%, a difference of 0.010%), French (91.0%, a difference of 0.010%), Austrian (91.0%, a difference of 0.030%), and Immigrants from Iran (90.9%, a difference of 0.030%).
| Demographics | Rating | Rank | High School Diploma |
| Zimbabweans | 99.7 /100 | #57 | Exceptional 91.1% |
| Slavs | 99.7 /100 | #58 | Exceptional 91.0% |
| Immigrants | North America | 99.7 /100 | #59 | Exceptional 91.0% |
| Immigrants | Japan | 99.6 /100 | #60 | Exceptional 91.0% |
| Immigrants | Taiwan | 99.6 /100 | #61 | Exceptional 91.0% |
| Austrians | 99.6 /100 | #62 | Exceptional 91.0% |
| Immigrants | Netherlands | 99.6 /100 | #63 | Exceptional 91.0% |
| Ukrainians | 99.6 /100 | #64 | Exceptional 91.0% |
| Immigrants | South Africa | 99.6 /100 | #65 | Exceptional 91.0% |
| French | 99.5 /100 | #66 | Exceptional 91.0% |
| Immigrants | Iran | 99.5 /100 | #67 | Exceptional 90.9% |
| Czechoslovakians | 99.5 /100 | #68 | Exceptional 90.9% |
| French Canadians | 99.5 /100 | #69 | Exceptional 90.9% |
| Immigrants | Latvia | 99.5 /100 | #70 | Exceptional 90.9% |
| Alaskan Athabascans | 99.4 /100 | #71 | Exceptional 90.9% |
Demographics Similar to Immigrants from Argentina by High School Diploma
In terms of high school diploma, the demographic groups most similar to Immigrants from Argentina are Alsatian (89.4%, a difference of 0.020%), Immigrants from Northern Africa (89.4%, a difference of 0.020%), Immigrants from Malaysia (89.3%, a difference of 0.030%), Immigrants from Iraq (89.4%, a difference of 0.050%), and Immigrants from Pakistan (89.3%, a difference of 0.050%).
| Demographics | Rating | Rank | High School Diploma |
| Immigrants | Poland | 72.9 /100 | #149 | Good 89.5% |
| Argentineans | 72.3 /100 | #150 | Good 89.5% |
| Paraguayans | 71.4 /100 | #151 | Good 89.5% |
| Asians | 70.7 /100 | #152 | Good 89.4% |
| Immigrants | Iraq | 68.7 /100 | #153 | Good 89.4% |
| Alsatians | 66.8 /100 | #154 | Good 89.4% |
| Immigrants | Northern Africa | 66.4 /100 | #155 | Good 89.4% |
| Immigrants | Argentina | 65.5 /100 | #156 | Good 89.4% |
| Immigrants | Malaysia | 63.5 /100 | #157 | Good 89.3% |
| Immigrants | Pakistan | 62.5 /100 | #158 | Good 89.3% |
| Immigrants | China | 62.0 /100 | #159 | Good 89.3% |
| Laotians | 61.8 /100 | #160 | Good 89.3% |
| Brazilians | 61.2 /100 | #161 | Good 89.3% |
| Bermudans | 61.1 /100 | #162 | Good 89.3% |
| Cree | 61.1 /100 | #163 | Good 89.3% |