Immigrants from Burma/Myanmar vs Bahamian 12th Grade, No Diploma
COMPARE
Immigrants from Burma/Myanmar
Bahamian
12th Grade, No Diploma
12th Grade, No Diploma Comparison
Immigrants from Burma/Myanmar
Bahamians
88.9%
12TH GRADE, NO DIPLOMA
0.0/ 100
METRIC RATING
280th/ 347
METRIC RANK
89.9%
12TH GRADE, NO DIPLOMA
0.9/ 100
METRIC RATING
252nd/ 347
METRIC RANK
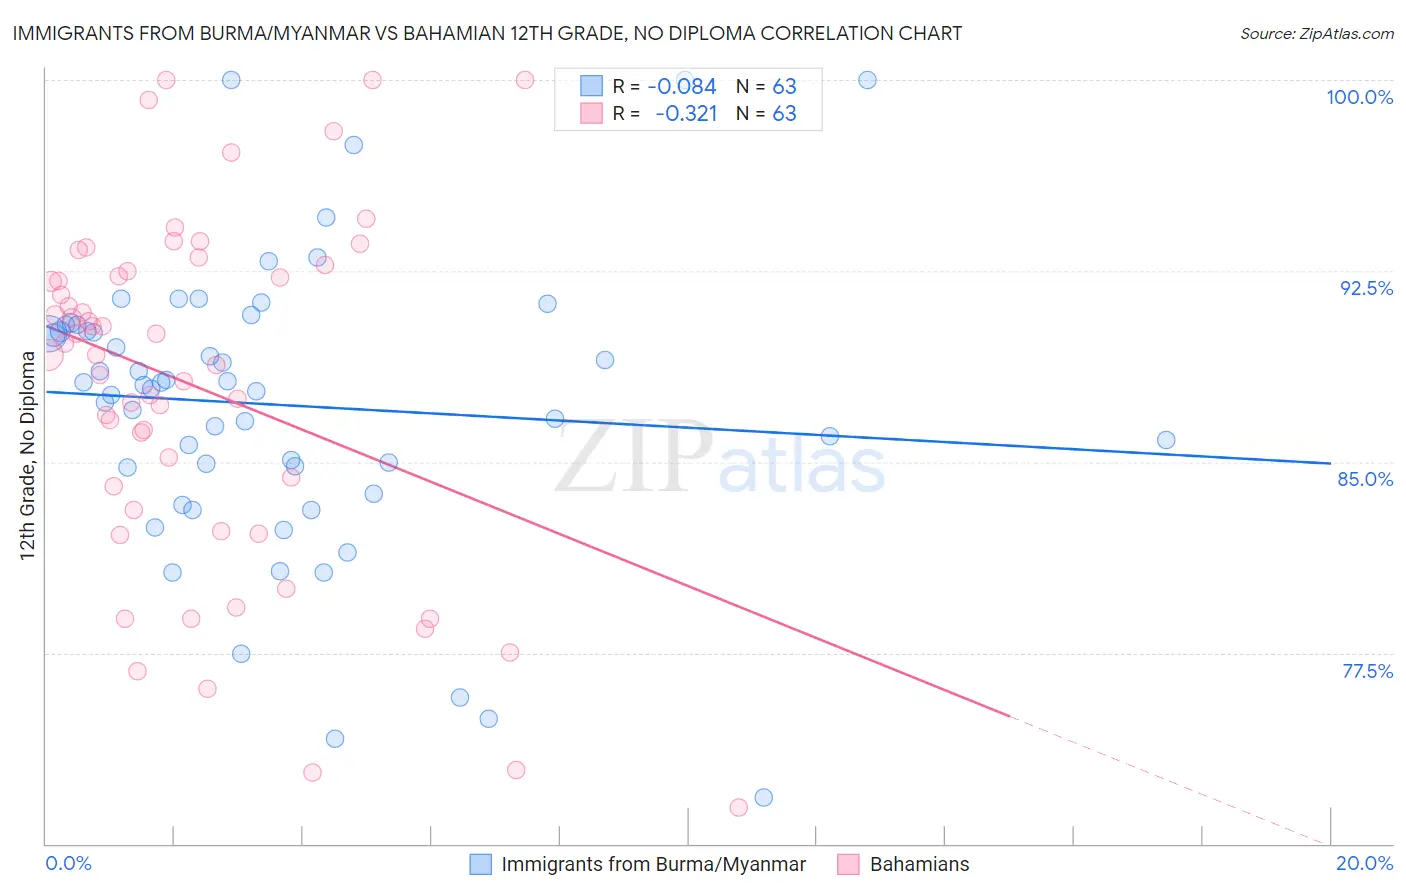
Immigrants from Burma/Myanmar vs Bahamian 12th Grade, No Diploma Correlation Chart
The statistical analysis conducted on geographies consisting of 172,345,696 people shows a slight negative correlation between the proportion of Immigrants from Burma/Myanmar and percentage of population with at least 12th grade (no diploma) education in the United States with a correlation coefficient (R) of -0.084 and weighted average of 88.9%. Similarly, the statistical analysis conducted on geographies consisting of 112,698,819 people shows a mild negative correlation between the proportion of Bahamians and percentage of population with at least 12th grade (no diploma) education in the United States with a correlation coefficient (R) of -0.321 and weighted average of 89.9%, a difference of 1.1%.
12th Grade, No Diploma Correlation Summary
| Measurement | Immigrants from Burma/Myanmar | Bahamian |
| Minimum | 71.8% | 71.4% |
| Maximum | 100.0% | 100.0% |
| Range | 28.2% | 28.6% |
| Mean | 87.2% | 87.9% |
| Median | 88.0% | 89.2% |
| Interquartile 25% (IQ1) | 84.8% | 83.1% |
| Interquartile 75% (IQ3) | 90.4% | 92.5% |
| Interquartile Range (IQR) | 5.6% | 9.4% |
| Standard Deviation (Sample) | 5.7% | 6.9% |
| Standard Deviation (Population) | 5.6% | 6.9% |
Similar Demographics by 12th Grade, No Diploma
Demographics Similar to Immigrants from Burma/Myanmar by 12th Grade, No Diploma
In terms of 12th grade, no diploma, the demographic groups most similar to Immigrants from Burma/Myanmar are Immigrants from Laos (88.9%, a difference of 0.0%), Cuban (88.9%, a difference of 0.010%), Immigrants from St. Vincent and the Grenadines (88.9%, a difference of 0.070%), Immigrants from Barbados (89.0%, a difference of 0.13%), and Immigrants from Vietnam (88.7%, a difference of 0.18%).
| Demographics | Rating | Rank | 12th Grade, No Diploma |
| Barbadians | 0.1 /100 | #273 | Tragic 89.1% |
| Cajuns | 0.1 /100 | #274 | Tragic 89.1% |
| Immigrants | Congo | 0.1 /100 | #275 | Tragic 89.0% |
| Ute | 0.1 /100 | #276 | Tragic 89.0% |
| Immigrants | Barbados | 0.0 /100 | #277 | Tragic 89.0% |
| Immigrants | St. Vincent and the Grenadines | 0.0 /100 | #278 | Tragic 88.9% |
| Immigrants | Laos | 0.0 /100 | #279 | Tragic 88.9% |
| Immigrants | Burma/Myanmar | 0.0 /100 | #280 | Tragic 88.9% |
| Cubans | 0.0 /100 | #281 | Tragic 88.9% |
| Immigrants | Vietnam | 0.0 /100 | #282 | Tragic 88.7% |
| Paiute | 0.0 /100 | #283 | Tragic 88.7% |
| Pennsylvania Germans | 0.0 /100 | #284 | Tragic 88.7% |
| Indonesians | 0.0 /100 | #285 | Tragic 88.6% |
| Immigrants | West Indies | 0.0 /100 | #286 | Tragic 88.6% |
| Hopi | 0.0 /100 | #287 | Tragic 88.6% |
Demographics Similar to Bahamians by 12th Grade, No Diploma
In terms of 12th grade, no diploma, the demographic groups most similar to Bahamians are Spanish American (89.9%, a difference of 0.0%), Immigrants from Eritrea (89.9%, a difference of 0.010%), Comanche (89.9%, a difference of 0.050%), Senegalese (89.9%, a difference of 0.050%), and Choctaw (89.8%, a difference of 0.080%).
| Demographics | Rating | Rank | 12th Grade, No Diploma |
| Immigrants | Uruguay | 1.4 /100 | #245 | Tragic 90.0% |
| Ghanaians | 1.3 /100 | #246 | Tragic 90.0% |
| Immigrants | Nigeria | 1.3 /100 | #247 | Tragic 89.9% |
| Comanche | 1.1 /100 | #248 | Tragic 89.9% |
| Senegalese | 1.1 /100 | #249 | Tragic 89.9% |
| Immigrants | Eritrea | 1.0 /100 | #250 | Tragic 89.9% |
| Spanish Americans | 0.9 /100 | #251 | Tragic 89.9% |
| Bahamians | 0.9 /100 | #252 | Tragic 89.9% |
| Choctaw | 0.7 /100 | #253 | Tragic 89.8% |
| Immigrants | Peru | 0.5 /100 | #254 | Tragic 89.7% |
| Immigrants | Senegal | 0.5 /100 | #255 | Tragic 89.7% |
| Immigrants | Ghana | 0.5 /100 | #256 | Tragic 89.7% |
| Jamaicans | 0.5 /100 | #257 | Tragic 89.7% |
| Africans | 0.4 /100 | #258 | Tragic 89.6% |
| Immigrants | Western Africa | 0.4 /100 | #259 | Tragic 89.6% |