Immigrants from Bulgaria vs Immigrants from Uganda College, 1 year or more
COMPARE
Immigrants from Bulgaria
Immigrants from Uganda
College, 1 year or more
College, 1 year or more Comparison
Immigrants from Bulgaria
Immigrants from Uganda
64.6%
COLLEGE, 1 YEAR OR MORE
99.9/ 100
METRIC RATING
48th/ 347
METRIC RANK
60.9%
COLLEGE, 1 YEAR OR MORE
87.4/ 100
METRIC RATING
135th/ 347
METRIC RANK
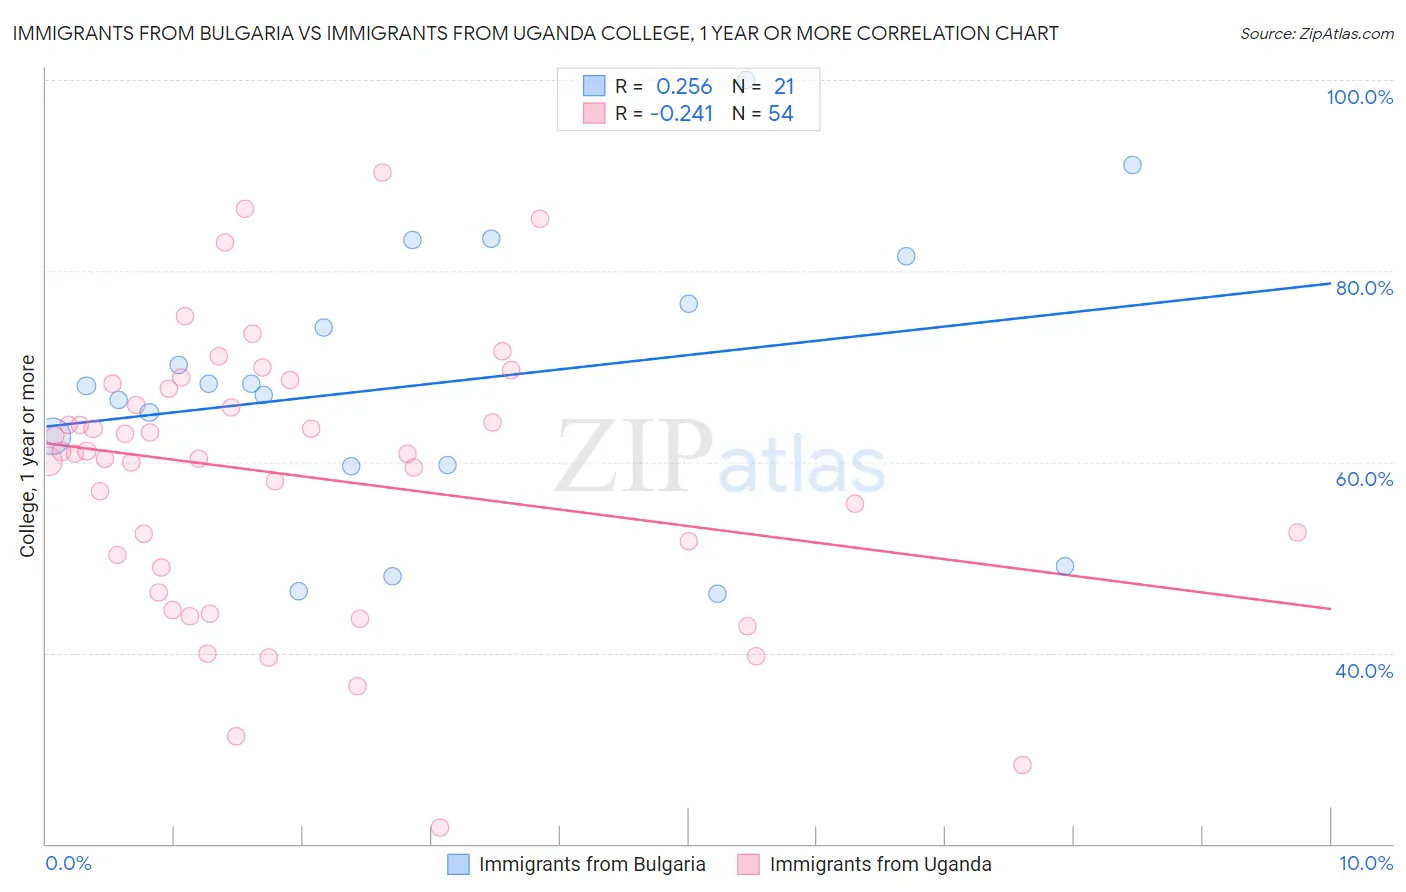
Immigrants from Bulgaria vs Immigrants from Uganda College, 1 year or more Correlation Chart
The statistical analysis conducted on geographies consisting of 172,550,092 people shows a weak positive correlation between the proportion of Immigrants from Bulgaria and percentage of population with at least college, 1 year or more education in the United States with a correlation coefficient (R) of 0.256 and weighted average of 64.6%. Similarly, the statistical analysis conducted on geographies consisting of 125,982,535 people shows a weak negative correlation between the proportion of Immigrants from Uganda and percentage of population with at least college, 1 year or more education in the United States with a correlation coefficient (R) of -0.241 and weighted average of 60.9%, a difference of 6.0%.
College, 1 year or more Correlation Summary
| Measurement | Immigrants from Bulgaria | Immigrants from Uganda |
| Minimum | 46.2% | 21.7% |
| Maximum | 100.0% | 90.3% |
| Range | 53.8% | 68.6% |
| Mean | 68.3% | 58.5% |
| Median | 68.0% | 60.9% |
| Interquartile 25% (IQ1) | 59.6% | 48.9% |
| Interquartile 75% (IQ3) | 79.1% | 67.6% |
| Interquartile Range (IQR) | 19.5% | 18.7% |
| Standard Deviation (Sample) | 14.5% | 14.4% |
| Standard Deviation (Population) | 14.1% | 14.3% |
Similar Demographics by College, 1 year or more
Demographics Similar to Immigrants from Bulgaria by College, 1 year or more
In terms of college, 1 year or more, the demographic groups most similar to Immigrants from Bulgaria are Australian (64.6%, a difference of 0.030%), Bhutanese (64.6%, a difference of 0.040%), New Zealander (64.6%, a difference of 0.040%), Immigrants from Lithuania (64.6%, a difference of 0.050%), and Immigrants from Norway (64.7%, a difference of 0.21%).
| Demographics | Rating | Rank | College, 1 year or more |
| Mongolians | 99.9 /100 | #41 | Exceptional 64.8% |
| Immigrants | Latvia | 99.9 /100 | #42 | Exceptional 64.8% |
| Immigrants | Russia | 99.9 /100 | #43 | Exceptional 64.7% |
| Immigrants | Norway | 99.9 /100 | #44 | Exceptional 64.7% |
| Immigrants | Lithuania | 99.9 /100 | #45 | Exceptional 64.6% |
| Bhutanese | 99.9 /100 | #46 | Exceptional 64.6% |
| Australians | 99.9 /100 | #47 | Exceptional 64.6% |
| Immigrants | Bulgaria | 99.9 /100 | #48 | Exceptional 64.6% |
| New Zealanders | 99.9 /100 | #49 | Exceptional 64.6% |
| Immigrants | Austria | 99.8 /100 | #50 | Exceptional 64.4% |
| Immigrants | Malaysia | 99.8 /100 | #51 | Exceptional 64.3% |
| Immigrants | Netherlands | 99.8 /100 | #52 | Exceptional 64.2% |
| Asians | 99.8 /100 | #53 | Exceptional 64.2% |
| Zimbabweans | 99.8 /100 | #54 | Exceptional 64.2% |
| Immigrants | Belarus | 99.7 /100 | #55 | Exceptional 64.1% |
Demographics Similar to Immigrants from Uganda by College, 1 year or more
In terms of college, 1 year or more, the demographic groups most similar to Immigrants from Uganda are Basque (60.9%, a difference of 0.020%), Immigrants from Venezuela (61.0%, a difference of 0.060%), Immigrants from Uzbekistan (61.0%, a difference of 0.070%), Scandinavian (61.0%, a difference of 0.10%), and Slovene (60.9%, a difference of 0.11%).
| Demographics | Rating | Rank | College, 1 year or more |
| Immigrants | Italy | 91.1 /100 | #128 | Exceptional 61.2% |
| Ugandans | 90.7 /100 | #129 | Exceptional 61.2% |
| Italians | 89.5 /100 | #130 | Excellent 61.1% |
| Immigrants | Morocco | 89.5 /100 | #131 | Excellent 61.1% |
| Scandinavians | 88.2 /100 | #132 | Excellent 61.0% |
| Immigrants | Uzbekistan | 88.0 /100 | #133 | Excellent 61.0% |
| Immigrants | Venezuela | 87.9 /100 | #134 | Excellent 61.0% |
| Immigrants | Uganda | 87.4 /100 | #135 | Excellent 60.9% |
| Basques | 87.2 /100 | #136 | Excellent 60.9% |
| Slovenes | 86.5 /100 | #137 | Excellent 60.9% |
| Taiwanese | 84.3 /100 | #138 | Excellent 60.7% |
| Immigrants | Eritrea | 84.3 /100 | #139 | Excellent 60.7% |
| Iraqis | 83.3 /100 | #140 | Excellent 60.7% |
| Immigrants | Afghanistan | 83.1 /100 | #141 | Excellent 60.7% |
| Poles | 82.8 /100 | #142 | Excellent 60.7% |