Immigrants from Thailand vs Immigrants from Uganda College, 1 year or more
COMPARE
Immigrants from Thailand
Immigrants from Uganda
College, 1 year or more
College, 1 year or more Comparison
Immigrants from Thailand
Immigrants from Uganda
58.6%
COLLEGE, 1 YEAR OR MORE
26.0/ 100
METRIC RATING
197th/ 347
METRIC RANK
60.9%
COLLEGE, 1 YEAR OR MORE
87.4/ 100
METRIC RATING
135th/ 347
METRIC RANK
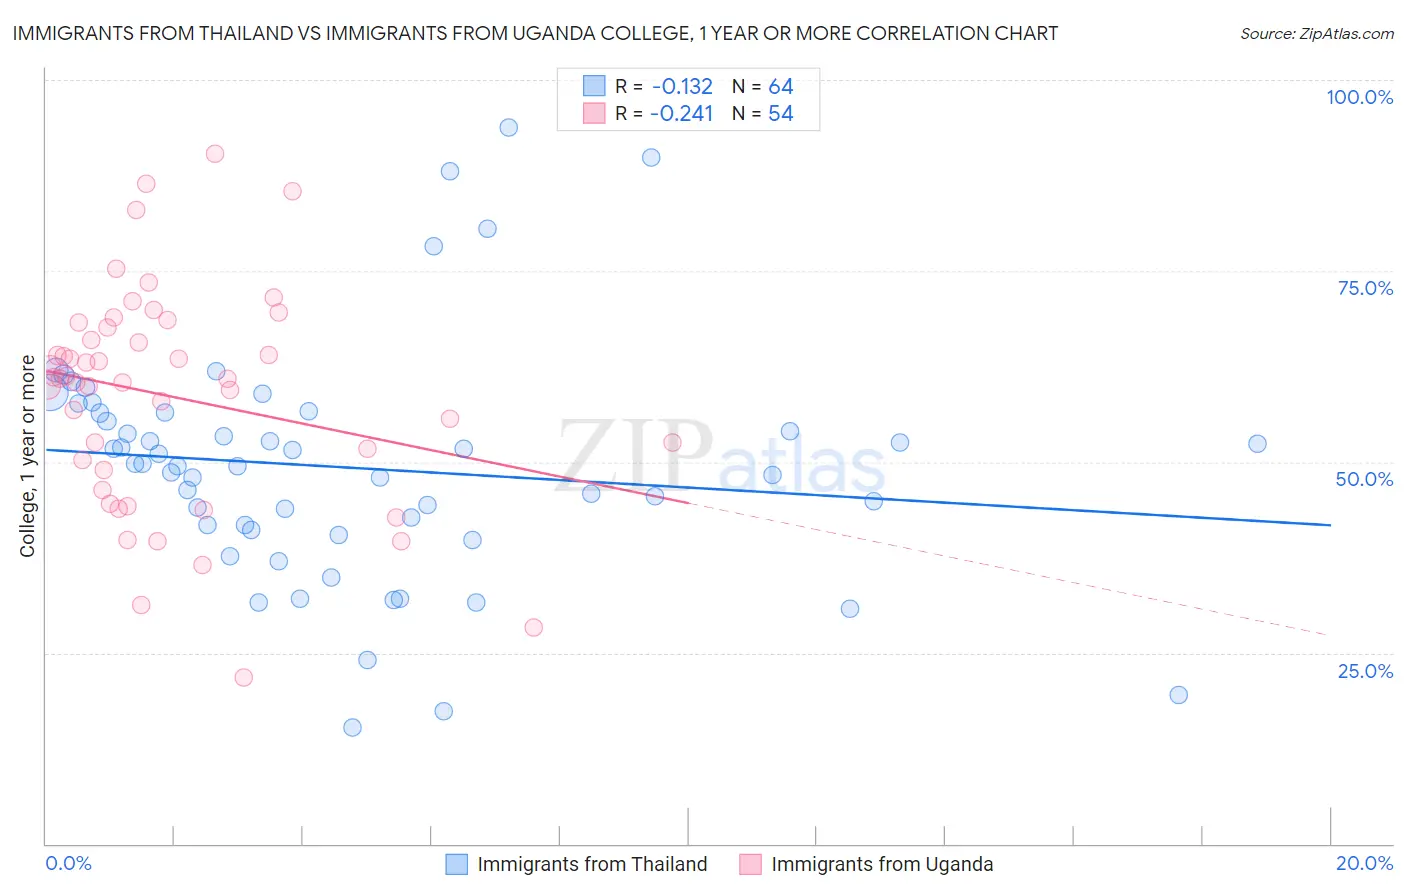
Immigrants from Thailand vs Immigrants from Uganda College, 1 year or more Correlation Chart
The statistical analysis conducted on geographies consisting of 317,023,435 people shows a poor negative correlation between the proportion of Immigrants from Thailand and percentage of population with at least college, 1 year or more education in the United States with a correlation coefficient (R) of -0.132 and weighted average of 58.6%. Similarly, the statistical analysis conducted on geographies consisting of 125,982,535 people shows a weak negative correlation between the proportion of Immigrants from Uganda and percentage of population with at least college, 1 year or more education in the United States with a correlation coefficient (R) of -0.241 and weighted average of 60.9%, a difference of 4.0%.
College, 1 year or more Correlation Summary
| Measurement | Immigrants from Thailand | Immigrants from Uganda |
| Minimum | 15.2% | 21.7% |
| Maximum | 93.8% | 90.3% |
| Range | 78.6% | 68.6% |
| Mean | 49.3% | 58.5% |
| Median | 49.6% | 60.9% |
| Interquartile 25% (IQ1) | 41.4% | 48.9% |
| Interquartile 75% (IQ3) | 56.5% | 67.6% |
| Interquartile Range (IQR) | 15.1% | 18.7% |
| Standard Deviation (Sample) | 15.4% | 14.4% |
| Standard Deviation (Population) | 15.3% | 14.3% |
Similar Demographics by College, 1 year or more
Demographics Similar to Immigrants from Thailand by College, 1 year or more
In terms of college, 1 year or more, the demographic groups most similar to Immigrants from Thailand are Dutch (58.6%, a difference of 0.010%), Guamanian/Chamorro (58.6%, a difference of 0.010%), Costa Rican (58.6%, a difference of 0.030%), Immigrants from South Eastern Asia (58.5%, a difference of 0.070%), and Peruvian (58.6%, a difference of 0.10%).
| Demographics | Rating | Rank | College, 1 year or more |
| Immigrants | Cameroon | 31.2 /100 | #190 | Fair 58.8% |
| Immigrants | Philippines | 29.2 /100 | #191 | Fair 58.7% |
| Colombians | 27.6 /100 | #192 | Fair 58.7% |
| Peruvians | 27.5 /100 | #193 | Fair 58.6% |
| Costa Ricans | 26.4 /100 | #194 | Fair 58.6% |
| Dutch | 26.2 /100 | #195 | Fair 58.6% |
| Guamanians/Chamorros | 26.2 /100 | #196 | Fair 58.6% |
| Immigrants | Thailand | 26.0 /100 | #197 | Fair 58.6% |
| Immigrants | South Eastern Asia | 25.1 /100 | #198 | Fair 58.5% |
| Slovaks | 24.6 /100 | #199 | Fair 58.5% |
| Spanish | 24.2 /100 | #200 | Fair 58.5% |
| Nigerians | 23.0 /100 | #201 | Fair 58.5% |
| Immigrants | South America | 21.9 /100 | #202 | Fair 58.4% |
| Ghanaians | 20.9 /100 | #203 | Fair 58.4% |
| Panamanians | 19.2 /100 | #204 | Poor 58.3% |
Demographics Similar to Immigrants from Uganda by College, 1 year or more
In terms of college, 1 year or more, the demographic groups most similar to Immigrants from Uganda are Basque (60.9%, a difference of 0.020%), Immigrants from Venezuela (61.0%, a difference of 0.060%), Immigrants from Uzbekistan (61.0%, a difference of 0.070%), Scandinavian (61.0%, a difference of 0.10%), and Slovene (60.9%, a difference of 0.11%).
| Demographics | Rating | Rank | College, 1 year or more |
| Immigrants | Italy | 91.1 /100 | #128 | Exceptional 61.2% |
| Ugandans | 90.7 /100 | #129 | Exceptional 61.2% |
| Italians | 89.5 /100 | #130 | Excellent 61.1% |
| Immigrants | Morocco | 89.5 /100 | #131 | Excellent 61.1% |
| Scandinavians | 88.2 /100 | #132 | Excellent 61.0% |
| Immigrants | Uzbekistan | 88.0 /100 | #133 | Excellent 61.0% |
| Immigrants | Venezuela | 87.9 /100 | #134 | Excellent 61.0% |
| Immigrants | Uganda | 87.4 /100 | #135 | Excellent 60.9% |
| Basques | 87.2 /100 | #136 | Excellent 60.9% |
| Slovenes | 86.5 /100 | #137 | Excellent 60.9% |
| Taiwanese | 84.3 /100 | #138 | Excellent 60.7% |
| Immigrants | Eritrea | 84.3 /100 | #139 | Excellent 60.7% |
| Iraqis | 83.3 /100 | #140 | Excellent 60.7% |
| Immigrants | Afghanistan | 83.1 /100 | #141 | Excellent 60.7% |
| Poles | 82.8 /100 | #142 | Excellent 60.7% |