Immigrants from Bulgaria vs Shoshone College, 1 year or more
COMPARE
Immigrants from Bulgaria
Shoshone
College, 1 year or more
College, 1 year or more Comparison
Immigrants from Bulgaria
Shoshone
64.6%
COLLEGE, 1 YEAR OR MORE
99.9/ 100
METRIC RATING
48th/ 347
METRIC RANK
54.3%
COLLEGE, 1 YEAR OR MORE
0.2/ 100
METRIC RATING
276th/ 347
METRIC RANK
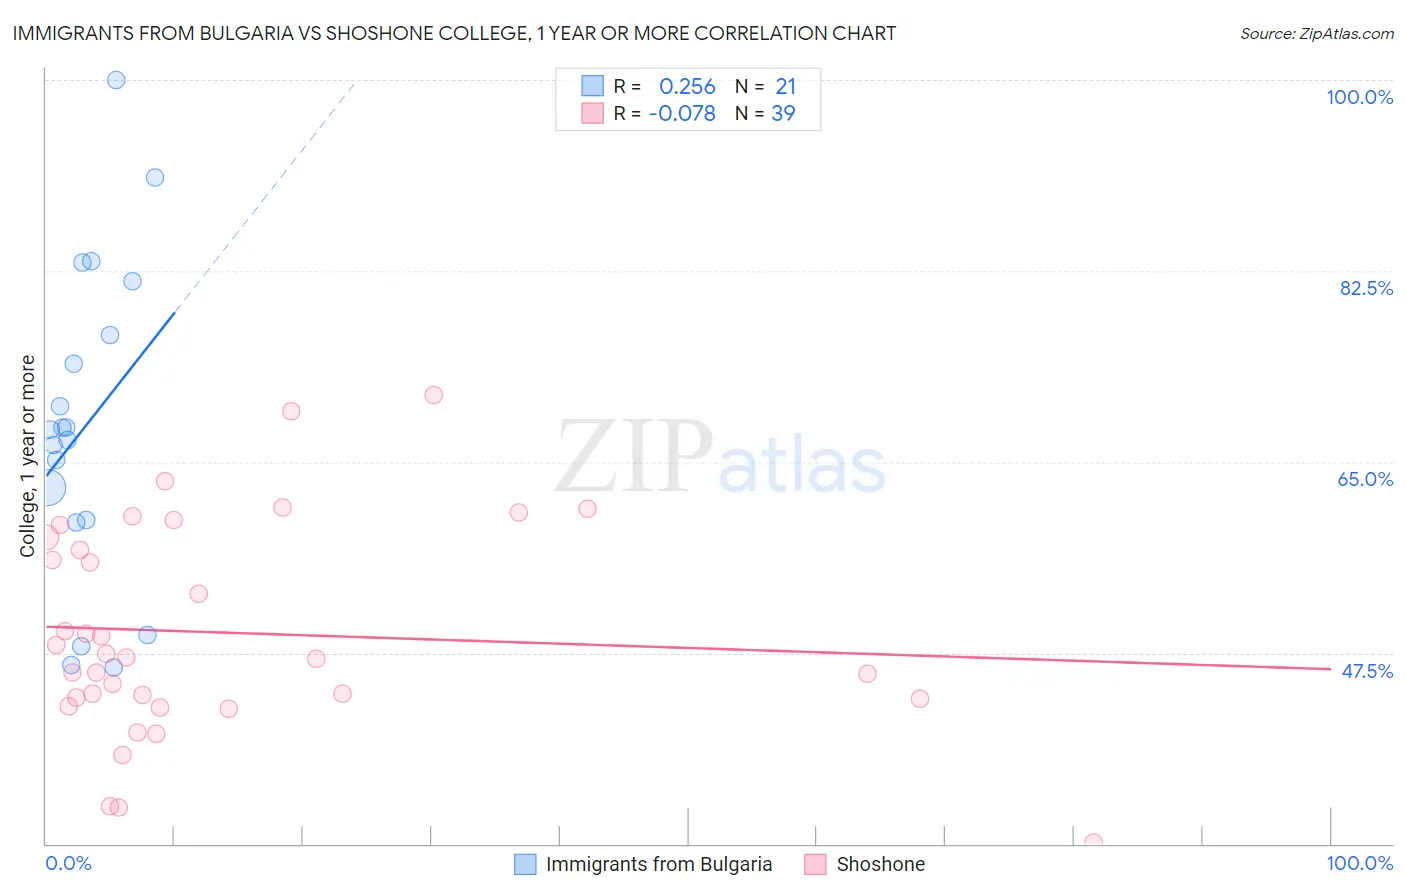
Immigrants from Bulgaria vs Shoshone College, 1 year or more Correlation Chart
The statistical analysis conducted on geographies consisting of 172,550,092 people shows a weak positive correlation between the proportion of Immigrants from Bulgaria and percentage of population with at least college, 1 year or more education in the United States with a correlation coefficient (R) of 0.256 and weighted average of 64.6%. Similarly, the statistical analysis conducted on geographies consisting of 66,627,303 people shows a slight negative correlation between the proportion of Shoshone and percentage of population with at least college, 1 year or more education in the United States with a correlation coefficient (R) of -0.078 and weighted average of 54.3%, a difference of 18.8%.
College, 1 year or more Correlation Summary
| Measurement | Immigrants from Bulgaria | Shoshone |
| Minimum | 46.2% | 30.1% |
| Maximum | 100.0% | 71.1% |
| Range | 53.8% | 41.0% |
| Mean | 68.3% | 49.3% |
| Median | 68.0% | 47.0% |
| Interquartile 25% (IQ1) | 59.6% | 43.3% |
| Interquartile 75% (IQ3) | 79.1% | 58.0% |
| Interquartile Range (IQR) | 19.5% | 14.7% |
| Standard Deviation (Sample) | 14.5% | 9.7% |
| Standard Deviation (Population) | 14.1% | 9.6% |
Similar Demographics by College, 1 year or more
Demographics Similar to Immigrants from Bulgaria by College, 1 year or more
In terms of college, 1 year or more, the demographic groups most similar to Immigrants from Bulgaria are Australian (64.6%, a difference of 0.030%), Bhutanese (64.6%, a difference of 0.040%), New Zealander (64.6%, a difference of 0.040%), Immigrants from Lithuania (64.6%, a difference of 0.050%), and Immigrants from Norway (64.7%, a difference of 0.21%).
| Demographics | Rating | Rank | College, 1 year or more |
| Mongolians | 99.9 /100 | #41 | Exceptional 64.8% |
| Immigrants | Latvia | 99.9 /100 | #42 | Exceptional 64.8% |
| Immigrants | Russia | 99.9 /100 | #43 | Exceptional 64.7% |
| Immigrants | Norway | 99.9 /100 | #44 | Exceptional 64.7% |
| Immigrants | Lithuania | 99.9 /100 | #45 | Exceptional 64.6% |
| Bhutanese | 99.9 /100 | #46 | Exceptional 64.6% |
| Australians | 99.9 /100 | #47 | Exceptional 64.6% |
| Immigrants | Bulgaria | 99.9 /100 | #48 | Exceptional 64.6% |
| New Zealanders | 99.9 /100 | #49 | Exceptional 64.6% |
| Immigrants | Austria | 99.8 /100 | #50 | Exceptional 64.4% |
| Immigrants | Malaysia | 99.8 /100 | #51 | Exceptional 64.3% |
| Immigrants | Netherlands | 99.8 /100 | #52 | Exceptional 64.2% |
| Asians | 99.8 /100 | #53 | Exceptional 64.2% |
| Zimbabweans | 99.8 /100 | #54 | Exceptional 64.2% |
| Immigrants | Belarus | 99.7 /100 | #55 | Exceptional 64.1% |
Demographics Similar to Shoshone by College, 1 year or more
In terms of college, 1 year or more, the demographic groups most similar to Shoshone are Ecuadorian (54.3%, a difference of 0.040%), American (54.4%, a difference of 0.080%), Belizean (54.4%, a difference of 0.11%), Immigrants from Grenada (54.4%, a difference of 0.15%), and Comanche (54.4%, a difference of 0.18%).
| Demographics | Rating | Rank | College, 1 year or more |
| Bangladeshis | 0.2 /100 | #269 | Tragic 54.5% |
| Crow | 0.2 /100 | #270 | Tragic 54.5% |
| Bahamians | 0.2 /100 | #271 | Tragic 54.5% |
| Comanche | 0.2 /100 | #272 | Tragic 54.4% |
| Immigrants | Grenada | 0.2 /100 | #273 | Tragic 54.4% |
| Belizeans | 0.2 /100 | #274 | Tragic 54.4% |
| Americans | 0.2 /100 | #275 | Tragic 54.4% |
| Shoshone | 0.2 /100 | #276 | Tragic 54.3% |
| Ecuadorians | 0.2 /100 | #277 | Tragic 54.3% |
| Immigrants | Jamaica | 0.1 /100 | #278 | Tragic 54.2% |
| Arapaho | 0.1 /100 | #279 | Tragic 54.1% |
| Cheyenne | 0.1 /100 | #280 | Tragic 54.1% |
| Colville | 0.1 /100 | #281 | Tragic 54.1% |
| Guyanese | 0.1 /100 | #282 | Tragic 54.1% |
| Nicaraguans | 0.1 /100 | #283 | Tragic 53.9% |