Immigrants from Bulgaria vs Danish College, 1 year or more
COMPARE
Immigrants from Bulgaria
Danish
College, 1 year or more
College, 1 year or more Comparison
Immigrants from Bulgaria
Danes
64.6%
COLLEGE, 1 YEAR OR MORE
99.9/ 100
METRIC RATING
48th/ 347
METRIC RANK
61.7%
COLLEGE, 1 YEAR OR MORE
94.8/ 100
METRIC RATING
114th/ 347
METRIC RANK
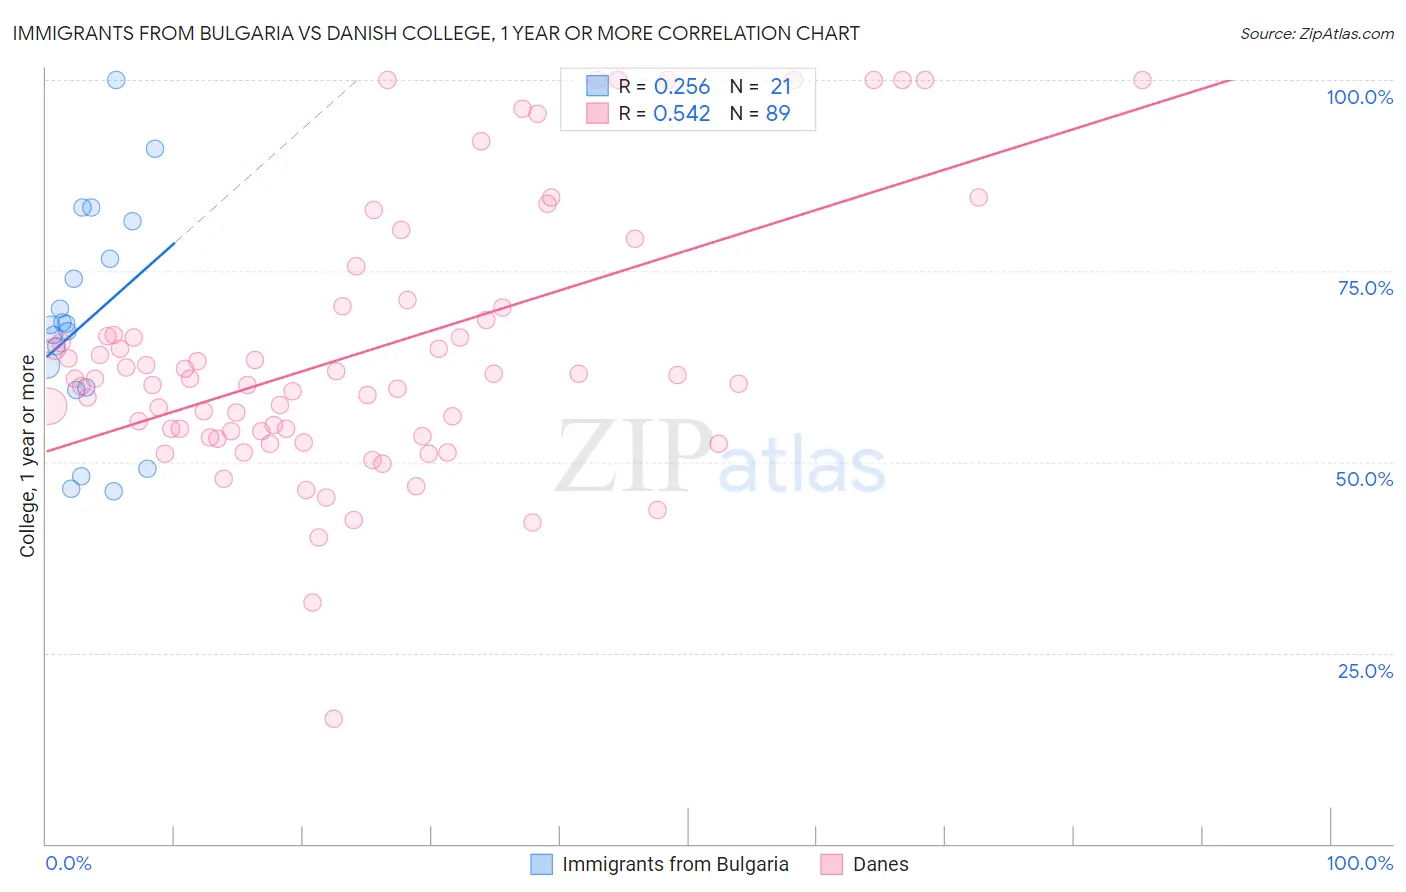
Immigrants from Bulgaria vs Danish College, 1 year or more Correlation Chart
The statistical analysis conducted on geographies consisting of 172,550,092 people shows a weak positive correlation between the proportion of Immigrants from Bulgaria and percentage of population with at least college, 1 year or more education in the United States with a correlation coefficient (R) of 0.256 and weighted average of 64.6%. Similarly, the statistical analysis conducted on geographies consisting of 474,193,590 people shows a substantial positive correlation between the proportion of Danes and percentage of population with at least college, 1 year or more education in the United States with a correlation coefficient (R) of 0.542 and weighted average of 61.7%, a difference of 4.7%.
College, 1 year or more Correlation Summary
| Measurement | Immigrants from Bulgaria | Danish |
| Minimum | 46.2% | 16.4% |
| Maximum | 100.0% | 100.0% |
| Range | 53.8% | 83.6% |
| Mean | 68.3% | 64.6% |
| Median | 68.0% | 60.9% |
| Interquartile 25% (IQ1) | 59.6% | 53.6% |
| Interquartile 75% (IQ3) | 79.1% | 70.3% |
| Interquartile Range (IQR) | 19.5% | 16.7% |
| Standard Deviation (Sample) | 14.5% | 17.7% |
| Standard Deviation (Population) | 14.1% | 17.6% |
Similar Demographics by College, 1 year or more
Demographics Similar to Immigrants from Bulgaria by College, 1 year or more
In terms of college, 1 year or more, the demographic groups most similar to Immigrants from Bulgaria are Australian (64.6%, a difference of 0.030%), Bhutanese (64.6%, a difference of 0.040%), New Zealander (64.6%, a difference of 0.040%), Immigrants from Lithuania (64.6%, a difference of 0.050%), and Immigrants from Norway (64.7%, a difference of 0.21%).
| Demographics | Rating | Rank | College, 1 year or more |
| Mongolians | 99.9 /100 | #41 | Exceptional 64.8% |
| Immigrants | Latvia | 99.9 /100 | #42 | Exceptional 64.8% |
| Immigrants | Russia | 99.9 /100 | #43 | Exceptional 64.7% |
| Immigrants | Norway | 99.9 /100 | #44 | Exceptional 64.7% |
| Immigrants | Lithuania | 99.9 /100 | #45 | Exceptional 64.6% |
| Bhutanese | 99.9 /100 | #46 | Exceptional 64.6% |
| Australians | 99.9 /100 | #47 | Exceptional 64.6% |
| Immigrants | Bulgaria | 99.9 /100 | #48 | Exceptional 64.6% |
| New Zealanders | 99.9 /100 | #49 | Exceptional 64.6% |
| Immigrants | Austria | 99.8 /100 | #50 | Exceptional 64.4% |
| Immigrants | Malaysia | 99.8 /100 | #51 | Exceptional 64.3% |
| Immigrants | Netherlands | 99.8 /100 | #52 | Exceptional 64.2% |
| Asians | 99.8 /100 | #53 | Exceptional 64.2% |
| Zimbabweans | 99.8 /100 | #54 | Exceptional 64.2% |
| Immigrants | Belarus | 99.7 /100 | #55 | Exceptional 64.1% |
Demographics Similar to Danes by College, 1 year or more
In terms of college, 1 year or more, the demographic groups most similar to Danes are Norwegian (61.7%, a difference of 0.070%), Ukrainian (61.8%, a difference of 0.11%), Lebanese (61.6%, a difference of 0.17%), Austrian (61.8%, a difference of 0.18%), and Arab (61.6%, a difference of 0.21%).
| Demographics | Rating | Rank | College, 1 year or more |
| Immigrants | Ukraine | 95.8 /100 | #107 | Exceptional 61.9% |
| Syrians | 95.7 /100 | #108 | Exceptional 61.9% |
| Immigrants | Northern Africa | 95.7 /100 | #109 | Exceptional 61.9% |
| Europeans | 95.6 /100 | #110 | Exceptional 61.8% |
| Macedonians | 95.6 /100 | #111 | Exceptional 61.8% |
| Austrians | 95.4 /100 | #112 | Exceptional 61.8% |
| Ukrainians | 95.2 /100 | #113 | Exceptional 61.8% |
| Danes | 94.8 /100 | #114 | Exceptional 61.7% |
| Norwegians | 94.5 /100 | #115 | Exceptional 61.7% |
| Lebanese | 94.1 /100 | #116 | Exceptional 61.6% |
| Arabs | 93.9 /100 | #117 | Exceptional 61.6% |
| Immigrants | Brazil | 93.9 /100 | #118 | Exceptional 61.6% |
| Assyrians/Chaldeans/Syriacs | 93.3 /100 | #119 | Exceptional 61.5% |
| Pakistanis | 93.2 /100 | #120 | Exceptional 61.5% |
| Immigrants | Jordan | 92.7 /100 | #121 | Exceptional 61.4% |