Immigrants from Belize vs Immigrants from Lebanon College, Under 1 year
COMPARE
Immigrants from Belize
Immigrants from Lebanon
College, Under 1 year
College, Under 1 year Comparison
Immigrants from Belize
Immigrants from Lebanon
59.1%
COLLEGE, UNDER 1 YEAR
0.0/ 100
METRIC RATING
294th/ 347
METRIC RANK
68.3%
COLLEGE, UNDER 1 YEAR
98.3/ 100
METRIC RATING
86th/ 347
METRIC RANK
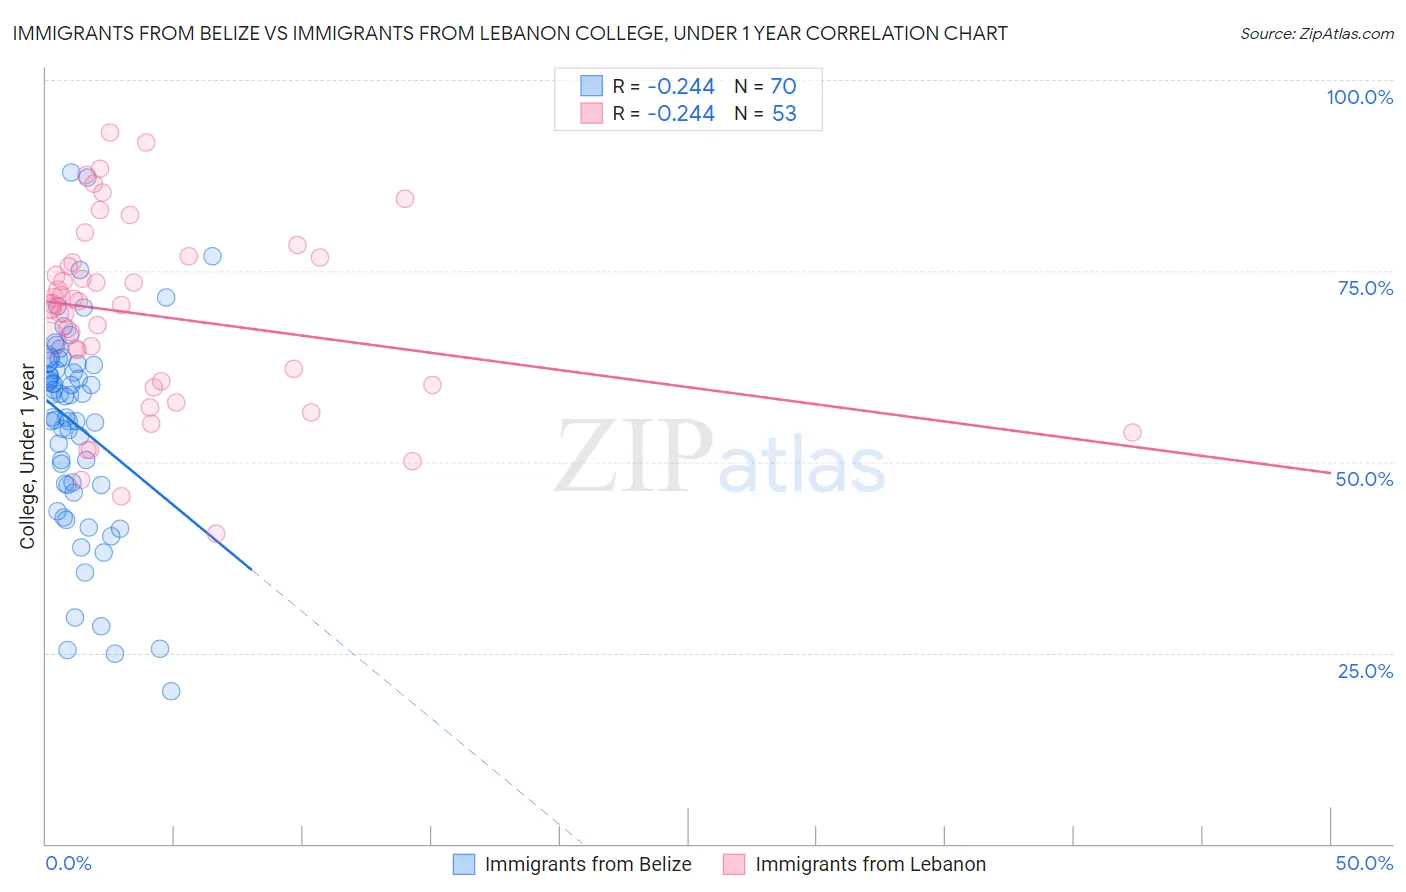
Immigrants from Belize vs Immigrants from Lebanon College, Under 1 year Correlation Chart
The statistical analysis conducted on geographies consisting of 130,329,081 people shows a weak negative correlation between the proportion of Immigrants from Belize and percentage of population with at least college, under 1 year education in the United States with a correlation coefficient (R) of -0.244 and weighted average of 59.1%. Similarly, the statistical analysis conducted on geographies consisting of 217,164,247 people shows a weak negative correlation between the proportion of Immigrants from Lebanon and percentage of population with at least college, under 1 year education in the United States with a correlation coefficient (R) of -0.244 and weighted average of 68.3%, a difference of 15.6%.
College, Under 1 year Correlation Summary
| Measurement | Immigrants from Belize | Immigrants from Lebanon |
| Minimum | 19.9% | 40.6% |
| Maximum | 87.9% | 93.2% |
| Range | 68.0% | 52.6% |
| Mean | 54.9% | 69.2% |
| Median | 58.7% | 70.6% |
| Interquartile 25% (IQ1) | 47.0% | 60.3% |
| Interquartile 75% (IQ3) | 62.9% | 76.5% |
| Interquartile Range (IQR) | 15.9% | 16.1% |
| Standard Deviation (Sample) | 13.7% | 12.1% |
| Standard Deviation (Population) | 13.6% | 12.0% |
Similar Demographics by College, Under 1 year
Demographics Similar to Immigrants from Belize by College, Under 1 year
In terms of college, under 1 year, the demographic groups most similar to Immigrants from Belize are Seminole (59.1%, a difference of 0.020%), Immigrants from Grenada (59.1%, a difference of 0.10%), Central American Indian (59.0%, a difference of 0.14%), Guyanese (59.0%, a difference of 0.19%), and Nicaraguan (59.2%, a difference of 0.20%).
| Demographics | Rating | Rank | College, Under 1 year |
| Sioux | 0.0 /100 | #287 | Tragic 59.4% |
| Blacks/African Americans | 0.0 /100 | #288 | Tragic 59.4% |
| Choctaw | 0.0 /100 | #289 | Tragic 59.3% |
| Ecuadorians | 0.0 /100 | #290 | Tragic 59.3% |
| Creek | 0.0 /100 | #291 | Tragic 59.3% |
| Nicaraguans | 0.0 /100 | #292 | Tragic 59.2% |
| Seminole | 0.0 /100 | #293 | Tragic 59.1% |
| Immigrants | Belize | 0.0 /100 | #294 | Tragic 59.1% |
| Immigrants | Grenada | 0.0 /100 | #295 | Tragic 59.1% |
| Central American Indians | 0.0 /100 | #296 | Tragic 59.0% |
| Guyanese | 0.0 /100 | #297 | Tragic 59.0% |
| Immigrants | Ecuador | 0.0 /100 | #298 | Tragic 58.7% |
| Cubans | 0.0 /100 | #299 | Tragic 58.6% |
| Immigrants | Guyana | 0.0 /100 | #300 | Tragic 58.5% |
| Mexican American Indians | 0.0 /100 | #301 | Tragic 58.1% |
Demographics Similar to Immigrants from Lebanon by College, Under 1 year
In terms of college, under 1 year, the demographic groups most similar to Immigrants from Lebanon are Egyptian (68.3%, a difference of 0.0%), Immigrants from Hungary (68.3%, a difference of 0.010%), Chinese (68.3%, a difference of 0.020%), Argentinean (68.4%, a difference of 0.030%), and Croatian (68.3%, a difference of 0.040%).
| Demographics | Rating | Rank | College, Under 1 year |
| Greeks | 98.6 /100 | #79 | Exceptional 68.5% |
| Immigrants | Spain | 98.5 /100 | #80 | Exceptional 68.4% |
| Immigrants | Greece | 98.5 /100 | #81 | Exceptional 68.4% |
| Norwegians | 98.4 /100 | #82 | Exceptional 68.4% |
| Argentineans | 98.4 /100 | #83 | Exceptional 68.4% |
| Immigrants | Hungary | 98.3 /100 | #84 | Exceptional 68.3% |
| Egyptians | 98.3 /100 | #85 | Exceptional 68.3% |
| Immigrants | Lebanon | 98.3 /100 | #86 | Exceptional 68.3% |
| Chinese | 98.3 /100 | #87 | Exceptional 68.3% |
| Croatians | 98.2 /100 | #88 | Exceptional 68.3% |
| Ethiopians | 98.2 /100 | #89 | Exceptional 68.3% |
| Icelanders | 98.1 /100 | #90 | Exceptional 68.3% |
| Europeans | 98.1 /100 | #91 | Exceptional 68.2% |
| Luxembourgers | 98.1 /100 | #92 | Exceptional 68.2% |
| Romanians | 97.9 /100 | #93 | Exceptional 68.2% |