Immigrants from Belize vs Pima College, Under 1 year
COMPARE
Immigrants from Belize
Pima
College, Under 1 year
College, Under 1 year Comparison
Immigrants from Belize
Pima
59.1%
COLLEGE, UNDER 1 YEAR
0.0/ 100
METRIC RATING
294th/ 347
METRIC RANK
51.4%
COLLEGE, UNDER 1 YEAR
0.0/ 100
METRIC RATING
345th/ 347
METRIC RANK
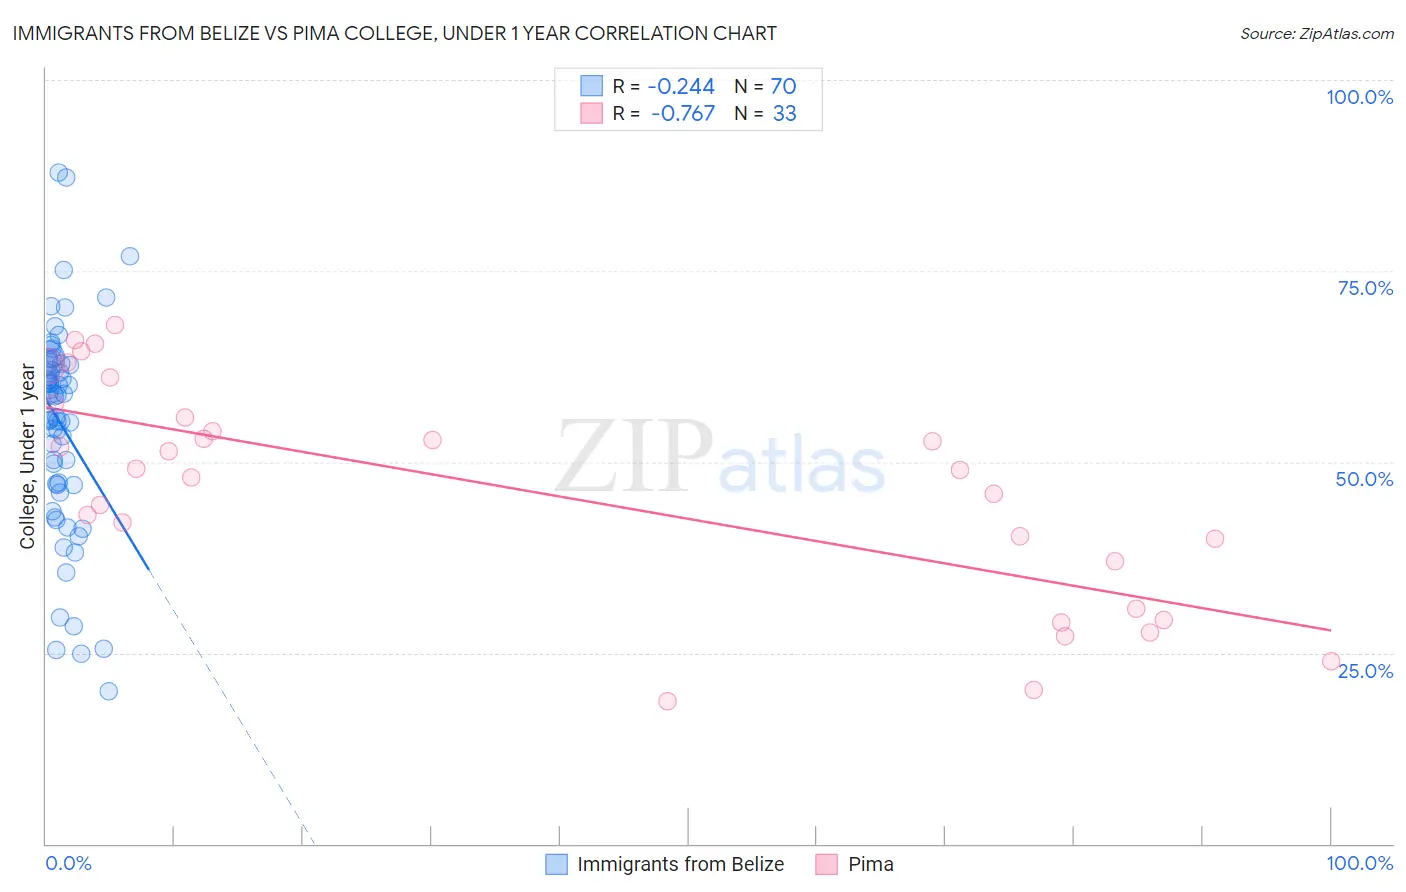
Immigrants from Belize vs Pima College, Under 1 year Correlation Chart
The statistical analysis conducted on geographies consisting of 130,329,081 people shows a weak negative correlation between the proportion of Immigrants from Belize and percentage of population with at least college, under 1 year education in the United States with a correlation coefficient (R) of -0.244 and weighted average of 59.1%. Similarly, the statistical analysis conducted on geographies consisting of 61,552,513 people shows a strong negative correlation between the proportion of Pima and percentage of population with at least college, under 1 year education in the United States with a correlation coefficient (R) of -0.767 and weighted average of 51.4%, a difference of 15.0%.
College, Under 1 year Correlation Summary
| Measurement | Immigrants from Belize | Pima |
| Minimum | 19.9% | 18.7% |
| Maximum | 87.9% | 68.0% |
| Range | 68.0% | 49.3% |
| Mean | 54.9% | 46.2% |
| Median | 58.7% | 48.9% |
| Interquartile 25% (IQ1) | 47.0% | 33.9% |
| Interquartile 75% (IQ3) | 62.9% | 56.7% |
| Interquartile Range (IQR) | 15.9% | 22.9% |
| Standard Deviation (Sample) | 13.7% | 14.2% |
| Standard Deviation (Population) | 13.6% | 14.0% |
Similar Demographics by College, Under 1 year
Demographics Similar to Immigrants from Belize by College, Under 1 year
In terms of college, under 1 year, the demographic groups most similar to Immigrants from Belize are Seminole (59.1%, a difference of 0.020%), Immigrants from Grenada (59.1%, a difference of 0.10%), Central American Indian (59.0%, a difference of 0.14%), Guyanese (59.0%, a difference of 0.19%), and Nicaraguan (59.2%, a difference of 0.20%).
| Demographics | Rating | Rank | College, Under 1 year |
| Sioux | 0.0 /100 | #287 | Tragic 59.4% |
| Blacks/African Americans | 0.0 /100 | #288 | Tragic 59.4% |
| Choctaw | 0.0 /100 | #289 | Tragic 59.3% |
| Ecuadorians | 0.0 /100 | #290 | Tragic 59.3% |
| Creek | 0.0 /100 | #291 | Tragic 59.3% |
| Nicaraguans | 0.0 /100 | #292 | Tragic 59.2% |
| Seminole | 0.0 /100 | #293 | Tragic 59.1% |
| Immigrants | Belize | 0.0 /100 | #294 | Tragic 59.1% |
| Immigrants | Grenada | 0.0 /100 | #295 | Tragic 59.1% |
| Central American Indians | 0.0 /100 | #296 | Tragic 59.0% |
| Guyanese | 0.0 /100 | #297 | Tragic 59.0% |
| Immigrants | Ecuador | 0.0 /100 | #298 | Tragic 58.7% |
| Cubans | 0.0 /100 | #299 | Tragic 58.6% |
| Immigrants | Guyana | 0.0 /100 | #300 | Tragic 58.5% |
| Mexican American Indians | 0.0 /100 | #301 | Tragic 58.1% |
Demographics Similar to Pima by College, Under 1 year
In terms of college, under 1 year, the demographic groups most similar to Pima are Yakama (52.6%, a difference of 2.4%), Tohono O'odham (52.8%, a difference of 2.7%), Immigrants from Mexico (53.7%, a difference of 4.3%), Immigrants from Cabo Verde (53.7%, a difference of 4.4%), and Spanish American Indian (54.0%, a difference of 5.0%).
| Demographics | Rating | Rank | College, Under 1 year |
| Yuman | 0.0 /100 | #333 | Tragic 55.1% |
| Immigrants | Azores | 0.0 /100 | #334 | Tragic 54.7% |
| Inupiat | 0.0 /100 | #335 | Tragic 54.6% |
| Pennsylvania Germans | 0.0 /100 | #336 | Tragic 54.5% |
| Immigrants | Central America | 0.0 /100 | #337 | Tragic 54.4% |
| Lumbee | 0.0 /100 | #338 | Tragic 54.2% |
| Immigrants | Dominican Republic | 0.0 /100 | #339 | Tragic 54.0% |
| Spanish American Indians | 0.0 /100 | #340 | Tragic 54.0% |
| Immigrants | Cabo Verde | 0.0 /100 | #341 | Tragic 53.7% |
| Immigrants | Mexico | 0.0 /100 | #342 | Tragic 53.7% |
| Tohono O'odham | 0.0 /100 | #343 | Tragic 52.8% |
| Yakama | 0.0 /100 | #344 | Tragic 52.6% |
| Pima | 0.0 /100 | #345 | Tragic 51.4% |
| Houma | 0.0 /100 | #346 | Tragic 47.6% |
| Yup'ik | 0.0 /100 | #347 | Tragic 45.8% |