Immigrants from Belize vs Mongolian College, Under 1 year
COMPARE
Immigrants from Belize
Mongolian
College, Under 1 year
College, Under 1 year Comparison
Immigrants from Belize
Mongolians
59.1%
COLLEGE, UNDER 1 YEAR
0.0/ 100
METRIC RATING
294th/ 347
METRIC RANK
69.9%
COLLEGE, UNDER 1 YEAR
99.8/ 100
METRIC RATING
51st/ 347
METRIC RANK
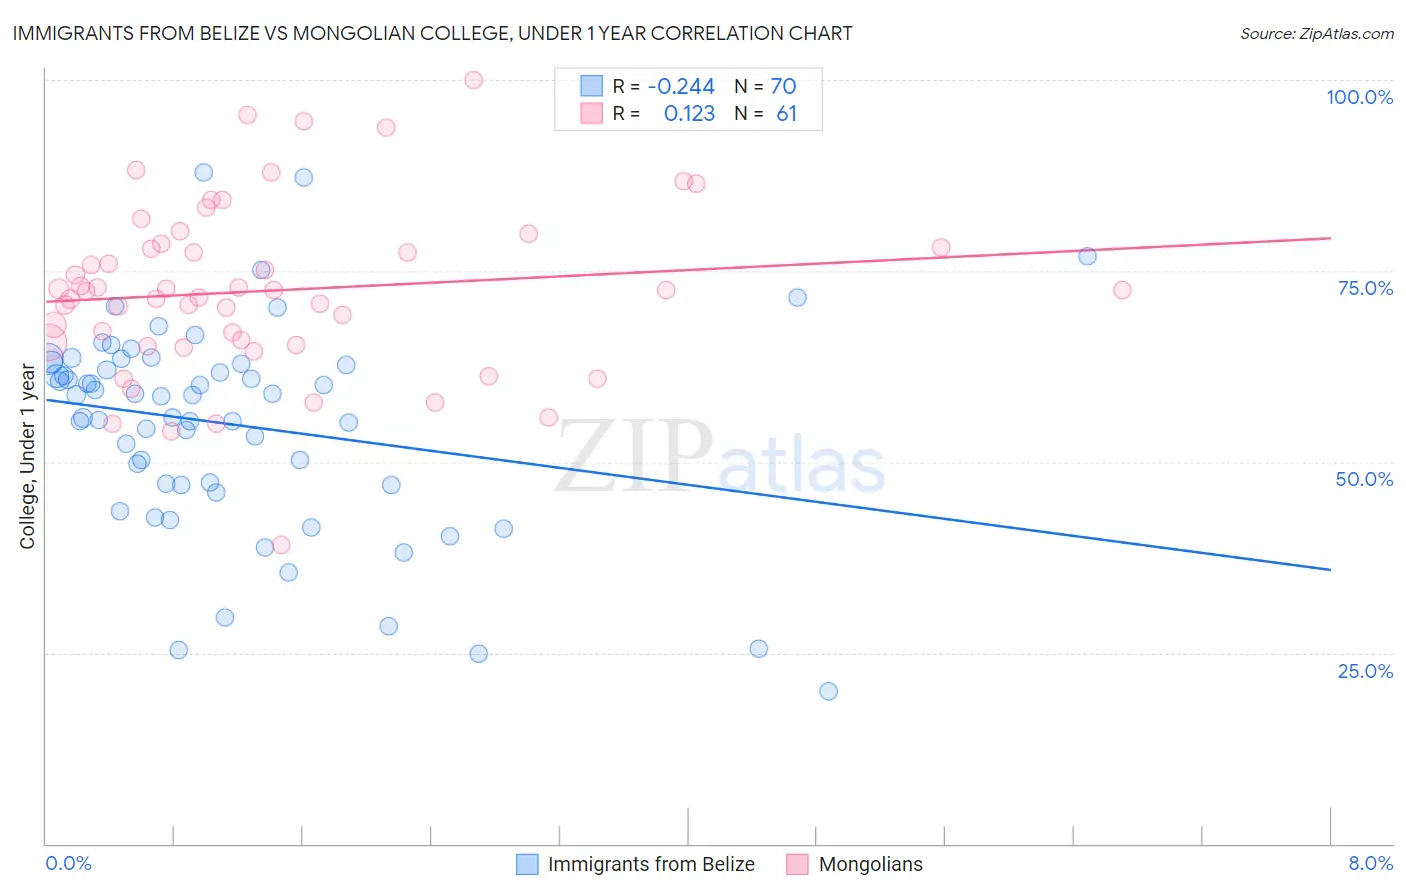
Immigrants from Belize vs Mongolian College, Under 1 year Correlation Chart
The statistical analysis conducted on geographies consisting of 130,329,081 people shows a weak negative correlation between the proportion of Immigrants from Belize and percentage of population with at least college, under 1 year education in the United States with a correlation coefficient (R) of -0.244 and weighted average of 59.1%. Similarly, the statistical analysis conducted on geographies consisting of 140,362,004 people shows a poor positive correlation between the proportion of Mongolians and percentage of population with at least college, under 1 year education in the United States with a correlation coefficient (R) of 0.123 and weighted average of 69.9%, a difference of 18.2%.
College, Under 1 year Correlation Summary
| Measurement | Immigrants from Belize | Mongolian |
| Minimum | 19.9% | 39.1% |
| Maximum | 87.9% | 100.0% |
| Range | 68.0% | 60.9% |
| Mean | 54.9% | 72.4% |
| Median | 58.7% | 72.4% |
| Interquartile 25% (IQ1) | 47.0% | 65.5% |
| Interquartile 75% (IQ3) | 62.9% | 78.3% |
| Interquartile Range (IQR) | 15.9% | 12.8% |
| Standard Deviation (Sample) | 13.7% | 11.3% |
| Standard Deviation (Population) | 13.6% | 11.2% |
Similar Demographics by College, Under 1 year
Demographics Similar to Immigrants from Belize by College, Under 1 year
In terms of college, under 1 year, the demographic groups most similar to Immigrants from Belize are Seminole (59.1%, a difference of 0.020%), Immigrants from Grenada (59.1%, a difference of 0.10%), Central American Indian (59.0%, a difference of 0.14%), Guyanese (59.0%, a difference of 0.19%), and Nicaraguan (59.2%, a difference of 0.20%).
| Demographics | Rating | Rank | College, Under 1 year |
| Sioux | 0.0 /100 | #287 | Tragic 59.4% |
| Blacks/African Americans | 0.0 /100 | #288 | Tragic 59.4% |
| Choctaw | 0.0 /100 | #289 | Tragic 59.3% |
| Ecuadorians | 0.0 /100 | #290 | Tragic 59.3% |
| Creek | 0.0 /100 | #291 | Tragic 59.3% |
| Nicaraguans | 0.0 /100 | #292 | Tragic 59.2% |
| Seminole | 0.0 /100 | #293 | Tragic 59.1% |
| Immigrants | Belize | 0.0 /100 | #294 | Tragic 59.1% |
| Immigrants | Grenada | 0.0 /100 | #295 | Tragic 59.1% |
| Central American Indians | 0.0 /100 | #296 | Tragic 59.0% |
| Guyanese | 0.0 /100 | #297 | Tragic 59.0% |
| Immigrants | Ecuador | 0.0 /100 | #298 | Tragic 58.7% |
| Cubans | 0.0 /100 | #299 | Tragic 58.6% |
| Immigrants | Guyana | 0.0 /100 | #300 | Tragic 58.5% |
| Mexican American Indians | 0.0 /100 | #301 | Tragic 58.1% |
Demographics Similar to Mongolians by College, Under 1 year
In terms of college, under 1 year, the demographic groups most similar to Mongolians are Immigrants from Russia (69.9%, a difference of 0.020%), Zimbabwean (69.9%, a difference of 0.040%), Immigrants from Austria (70.0%, a difference of 0.15%), Immigrants from Netherlands (70.0%, a difference of 0.20%), and Immigrants from Bulgaria (70.0%, a difference of 0.25%).
| Demographics | Rating | Rank | College, Under 1 year |
| New Zealanders | 99.9 /100 | #44 | Exceptional 70.2% |
| Immigrants | Norway | 99.9 /100 | #45 | Exceptional 70.2% |
| Immigrants | Latvia | 99.9 /100 | #46 | Exceptional 70.1% |
| Immigrants | Bulgaria | 99.8 /100 | #47 | Exceptional 70.0% |
| Immigrants | Netherlands | 99.8 /100 | #48 | Exceptional 70.0% |
| Immigrants | Austria | 99.8 /100 | #49 | Exceptional 70.0% |
| Zimbabweans | 99.8 /100 | #50 | Exceptional 69.9% |
| Mongolians | 99.8 /100 | #51 | Exceptional 69.9% |
| Immigrants | Russia | 99.8 /100 | #52 | Exceptional 69.9% |
| South Africans | 99.7 /100 | #53 | Exceptional 69.7% |
| Immigrants | Czechoslovakia | 99.7 /100 | #54 | Exceptional 69.6% |
| Maltese | 99.7 /100 | #55 | Exceptional 69.5% |
| Immigrants | Scotland | 99.6 /100 | #56 | Exceptional 69.4% |
| Asians | 99.6 /100 | #57 | Exceptional 69.4% |
| Immigrants | Malaysia | 99.6 /100 | #58 | Exceptional 69.3% |