Immigrants from Belize vs Immigrants from Ukraine College, Under 1 year
COMPARE
Immigrants from Belize
Immigrants from Ukraine
College, Under 1 year
College, Under 1 year Comparison
Immigrants from Belize
Immigrants from Ukraine
59.1%
COLLEGE, UNDER 1 YEAR
0.0/ 100
METRIC RATING
294th/ 347
METRIC RANK
67.5%
COLLEGE, UNDER 1 YEAR
94.7/ 100
METRIC RATING
118th/ 347
METRIC RANK
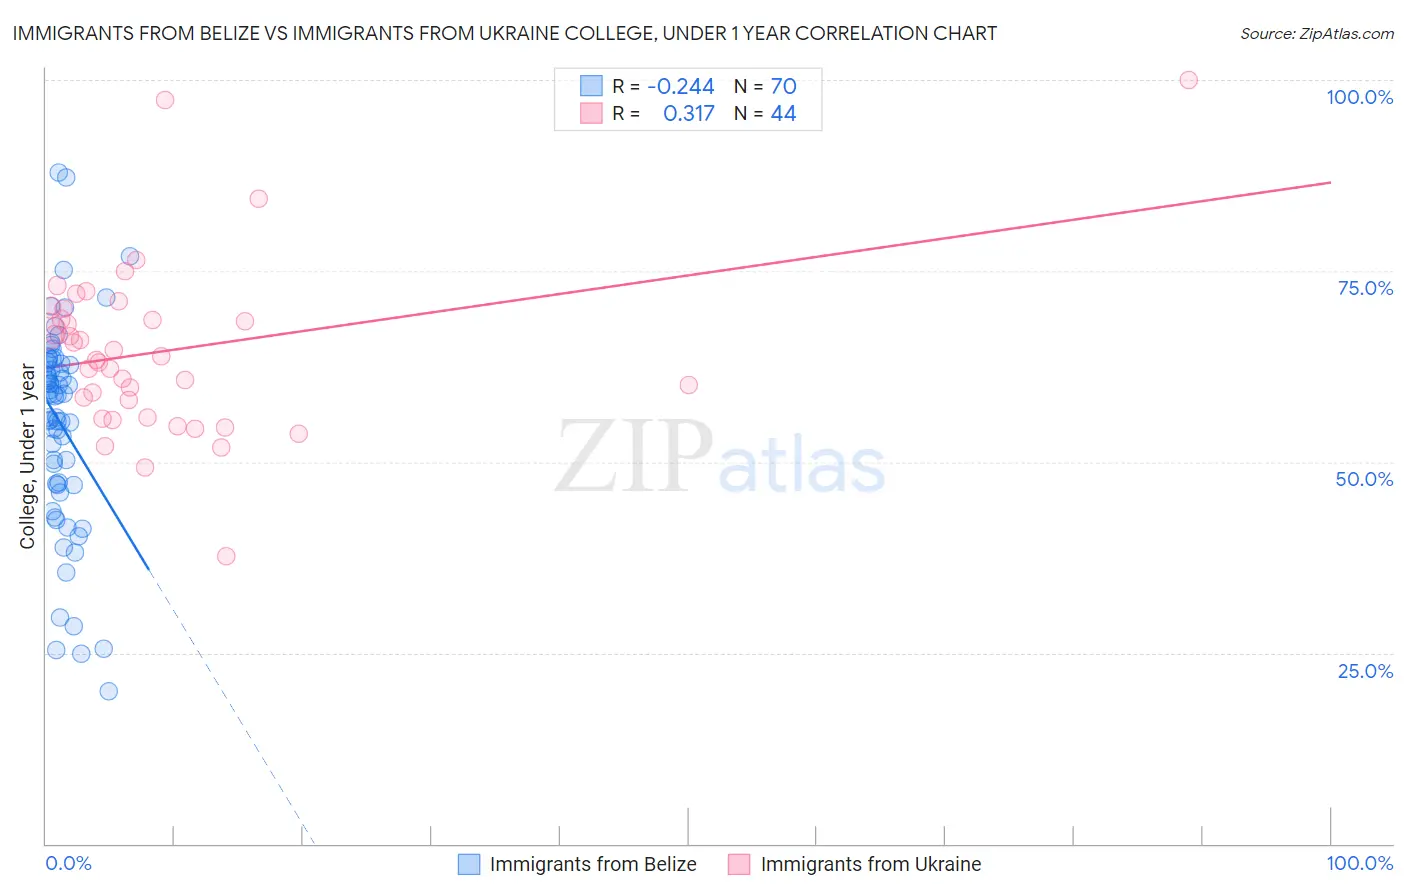
Immigrants from Belize vs Immigrants from Ukraine College, Under 1 year Correlation Chart
The statistical analysis conducted on geographies consisting of 130,329,081 people shows a weak negative correlation between the proportion of Immigrants from Belize and percentage of population with at least college, under 1 year education in the United States with a correlation coefficient (R) of -0.244 and weighted average of 59.1%. Similarly, the statistical analysis conducted on geographies consisting of 289,712,789 people shows a mild positive correlation between the proportion of Immigrants from Ukraine and percentage of population with at least college, under 1 year education in the United States with a correlation coefficient (R) of 0.317 and weighted average of 67.5%, a difference of 14.1%.
College, Under 1 year Correlation Summary
| Measurement | Immigrants from Belize | Immigrants from Ukraine |
| Minimum | 19.9% | 37.7% |
| Maximum | 87.9% | 100.0% |
| Range | 68.0% | 62.3% |
| Mean | 54.9% | 64.5% |
| Median | 58.7% | 63.6% |
| Interquartile 25% (IQ1) | 47.0% | 56.9% |
| Interquartile 75% (IQ3) | 62.9% | 69.4% |
| Interquartile Range (IQR) | 15.9% | 12.5% |
| Standard Deviation (Sample) | 13.7% | 11.3% |
| Standard Deviation (Population) | 13.6% | 11.2% |
Similar Demographics by College, Under 1 year
Demographics Similar to Immigrants from Belize by College, Under 1 year
In terms of college, under 1 year, the demographic groups most similar to Immigrants from Belize are Seminole (59.1%, a difference of 0.020%), Immigrants from Grenada (59.1%, a difference of 0.10%), Central American Indian (59.0%, a difference of 0.14%), Guyanese (59.0%, a difference of 0.19%), and Nicaraguan (59.2%, a difference of 0.20%).
| Demographics | Rating | Rank | College, Under 1 year |
| Sioux | 0.0 /100 | #287 | Tragic 59.4% |
| Blacks/African Americans | 0.0 /100 | #288 | Tragic 59.4% |
| Choctaw | 0.0 /100 | #289 | Tragic 59.3% |
| Ecuadorians | 0.0 /100 | #290 | Tragic 59.3% |
| Creek | 0.0 /100 | #291 | Tragic 59.3% |
| Nicaraguans | 0.0 /100 | #292 | Tragic 59.2% |
| Seminole | 0.0 /100 | #293 | Tragic 59.1% |
| Immigrants | Belize | 0.0 /100 | #294 | Tragic 59.1% |
| Immigrants | Grenada | 0.0 /100 | #295 | Tragic 59.1% |
| Central American Indians | 0.0 /100 | #296 | Tragic 59.0% |
| Guyanese | 0.0 /100 | #297 | Tragic 59.0% |
| Immigrants | Ecuador | 0.0 /100 | #298 | Tragic 58.7% |
| Cubans | 0.0 /100 | #299 | Tragic 58.6% |
| Immigrants | Guyana | 0.0 /100 | #300 | Tragic 58.5% |
| Mexican American Indians | 0.0 /100 | #301 | Tragic 58.1% |
Demographics Similar to Immigrants from Ukraine by College, Under 1 year
In terms of college, under 1 year, the demographic groups most similar to Immigrants from Ukraine are Lebanese (67.5%, a difference of 0.010%), Pakistani (67.5%, a difference of 0.030%), Immigrants from Nepal (67.5%, a difference of 0.040%), Basque (67.6%, a difference of 0.13%), and Chilean (67.6%, a difference of 0.14%).
| Demographics | Rating | Rank | College, Under 1 year |
| Ukrainians | 95.8 /100 | #111 | Exceptional 67.7% |
| Macedonians | 95.7 /100 | #112 | Exceptional 67.6% |
| Syrians | 95.6 /100 | #113 | Exceptional 67.6% |
| Chileans | 95.3 /100 | #114 | Exceptional 67.6% |
| Basques | 95.2 /100 | #115 | Exceptional 67.6% |
| Immigrants | Nepal | 94.9 /100 | #116 | Exceptional 67.5% |
| Pakistanis | 94.8 /100 | #117 | Exceptional 67.5% |
| Immigrants | Ukraine | 94.7 /100 | #118 | Exceptional 67.5% |
| Lebanese | 94.6 /100 | #119 | Exceptional 67.5% |
| Serbians | 93.9 /100 | #120 | Exceptional 67.4% |
| Slovenes | 93.3 /100 | #121 | Exceptional 67.3% |
| Immigrants | Jordan | 92.8 /100 | #122 | Exceptional 67.3% |
| Immigrants | Northern Africa | 92.7 /100 | #123 | Exceptional 67.2% |
| Arabs | 92.6 /100 | #124 | Exceptional 67.2% |
| Italians | 91.8 /100 | #125 | Exceptional 67.2% |