Immigrants from Barbados vs Hopi Master's Degree
COMPARE
Immigrants from Barbados
Hopi
Master's Degree
Master's Degree Comparison
Immigrants from Barbados
Hopi
14.3%
MASTER'S DEGREE
20.5/ 100
METRIC RATING
208th/ 347
METRIC RANK
10.9%
MASTER'S DEGREE
0.0/ 100
METRIC RATING
317th/ 347
METRIC RANK
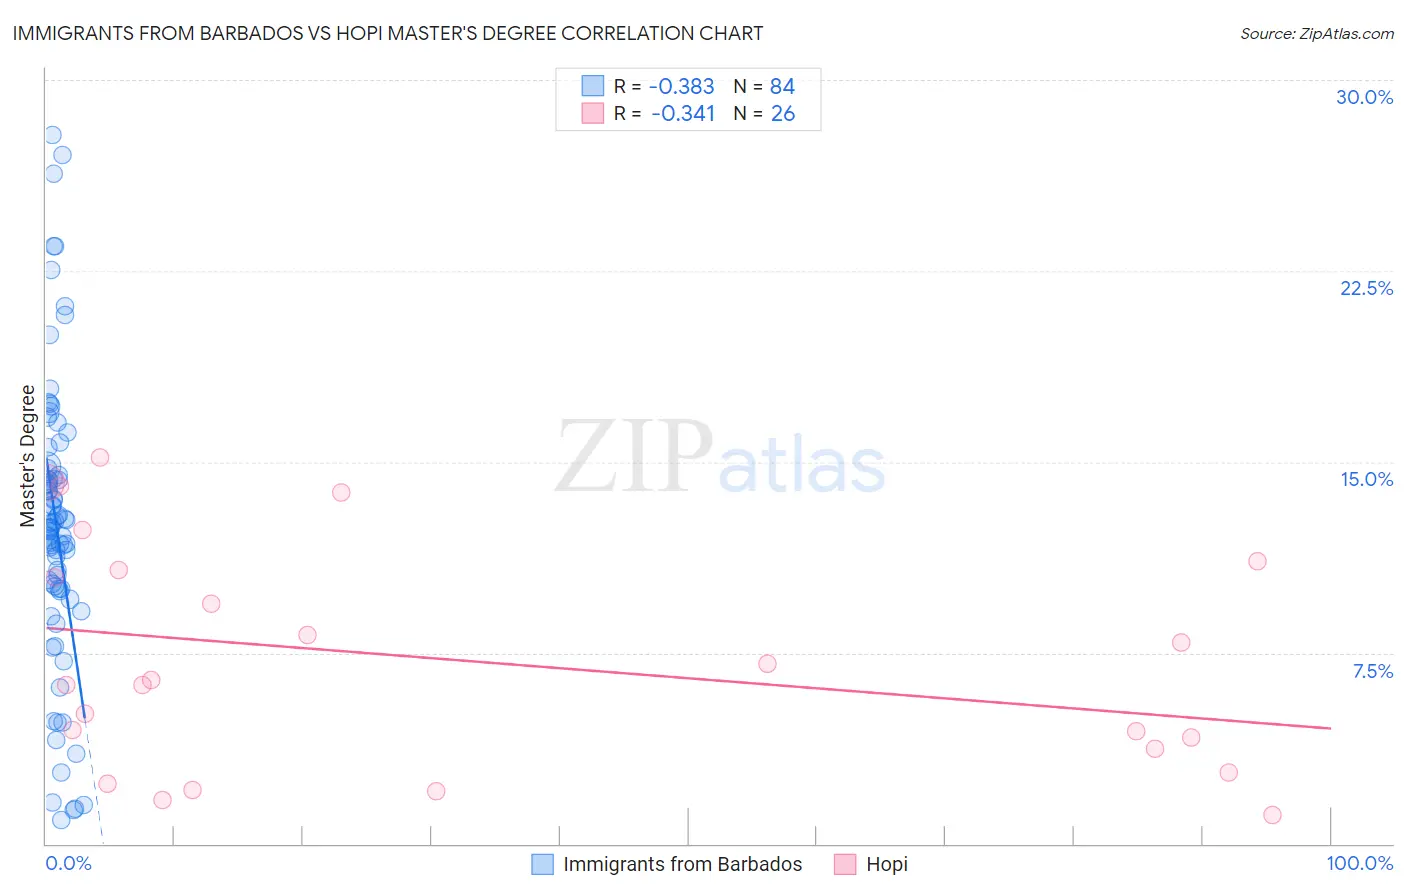
Immigrants from Barbados vs Hopi Master's Degree Correlation Chart
The statistical analysis conducted on geographies consisting of 112,776,866 people shows a mild negative correlation between the proportion of Immigrants from Barbados and percentage of population with at least master's degree education in the United States with a correlation coefficient (R) of -0.383 and weighted average of 14.3%. Similarly, the statistical analysis conducted on geographies consisting of 74,729,525 people shows a mild negative correlation between the proportion of Hopi and percentage of population with at least master's degree education in the United States with a correlation coefficient (R) of -0.341 and weighted average of 10.9%, a difference of 31.3%.
Master's Degree Correlation Summary
| Measurement | Immigrants from Barbados | Hopi |
| Minimum | 0.92% | 1.1% |
| Maximum | 27.8% | 15.2% |
| Range | 26.9% | 14.1% |
| Mean | 12.5% | 7.2% |
| Median | 12.4% | 6.3% |
| Interquartile 25% (IQ1) | 10.0% | 3.7% |
| Interquartile 75% (IQ3) | 14.6% | 10.8% |
| Interquartile Range (IQR) | 4.6% | 7.0% |
| Standard Deviation (Sample) | 5.7% | 4.4% |
| Standard Deviation (Population) | 5.6% | 4.3% |
Similar Demographics by Master's Degree
Demographics Similar to Immigrants from Barbados by Master's Degree
In terms of master's degree, the demographic groups most similar to Immigrants from Barbados are Immigrants from Panama (14.3%, a difference of 0.090%), Subsaharan African (14.2%, a difference of 0.22%), Immigrants from Bosnia and Herzegovina (14.3%, a difference of 0.30%), Somali (14.2%, a difference of 0.53%), and Scandinavian (14.4%, a difference of 0.55%).
| Demographics | Rating | Rank | Master's Degree |
| Scotch-Irish | 25.0 /100 | #201 | Fair 14.4% |
| Immigrants | Western Africa | 24.9 /100 | #202 | Fair 14.4% |
| Yugoslavians | 24.3 /100 | #203 | Fair 14.4% |
| French | 23.7 /100 | #204 | Fair 14.4% |
| Trinidadians and Tobagonians | 23.5 /100 | #205 | Fair 14.4% |
| Scandinavians | 23.3 /100 | #206 | Fair 14.4% |
| Immigrants | Bosnia and Herzegovina | 22.0 /100 | #207 | Fair 14.3% |
| Immigrants | Barbados | 20.5 /100 | #208 | Fair 14.3% |
| Immigrants | Panama | 20.0 /100 | #209 | Fair 14.3% |
| Sub-Saharan Africans | 19.4 /100 | #210 | Poor 14.2% |
| Somalis | 18.0 /100 | #211 | Poor 14.2% |
| Spanish | 17.8 /100 | #212 | Poor 14.2% |
| Immigrants | Thailand | 17.0 /100 | #213 | Poor 14.2% |
| Finns | 16.9 /100 | #214 | Poor 14.2% |
| Immigrants | Vietnam | 16.1 /100 | #215 | Poor 14.1% |
Demographics Similar to Hopi by Master's Degree
In terms of master's degree, the demographic groups most similar to Hopi are Immigrants from Cuba (10.9%, a difference of 0.13%), Kiowa (10.8%, a difference of 0.37%), Hispanic or Latino (10.9%, a difference of 0.54%), Cajun (11.0%, a difference of 0.88%), and Apache (11.0%, a difference of 0.88%).
| Demographics | Rating | Rank | Master's Degree |
| Shoshone | 0.0 /100 | #310 | Tragic 11.1% |
| Seminole | 0.0 /100 | #311 | Tragic 11.0% |
| Choctaw | 0.0 /100 | #312 | Tragic 11.0% |
| Yaqui | 0.0 /100 | #313 | Tragic 11.0% |
| Cajuns | 0.0 /100 | #314 | Tragic 11.0% |
| Apache | 0.0 /100 | #315 | Tragic 11.0% |
| Hispanics or Latinos | 0.0 /100 | #316 | Tragic 10.9% |
| Hopi | 0.0 /100 | #317 | Tragic 10.9% |
| Immigrants | Cuba | 0.0 /100 | #318 | Tragic 10.9% |
| Kiowa | 0.0 /100 | #319 | Tragic 10.8% |
| Immigrants | Micronesia | 0.0 /100 | #320 | Tragic 10.8% |
| Pennsylvania Germans | 0.0 /100 | #321 | Tragic 10.7% |
| Sioux | 0.0 /100 | #322 | Tragic 10.7% |
| Crow | 0.0 /100 | #323 | Tragic 10.6% |
| Dutch West Indians | 0.0 /100 | #324 | Tragic 10.6% |