Immigrants from Barbados vs Immigrants from Somalia Master's Degree
COMPARE
Immigrants from Barbados
Immigrants from Somalia
Master's Degree
Master's Degree Comparison
Immigrants from Barbados
Immigrants from Somalia
14.3%
MASTER'S DEGREE
20.5/ 100
METRIC RATING
208th/ 347
METRIC RANK
14.1%
MASTER'S DEGREE
15.8/ 100
METRIC RATING
216th/ 347
METRIC RANK
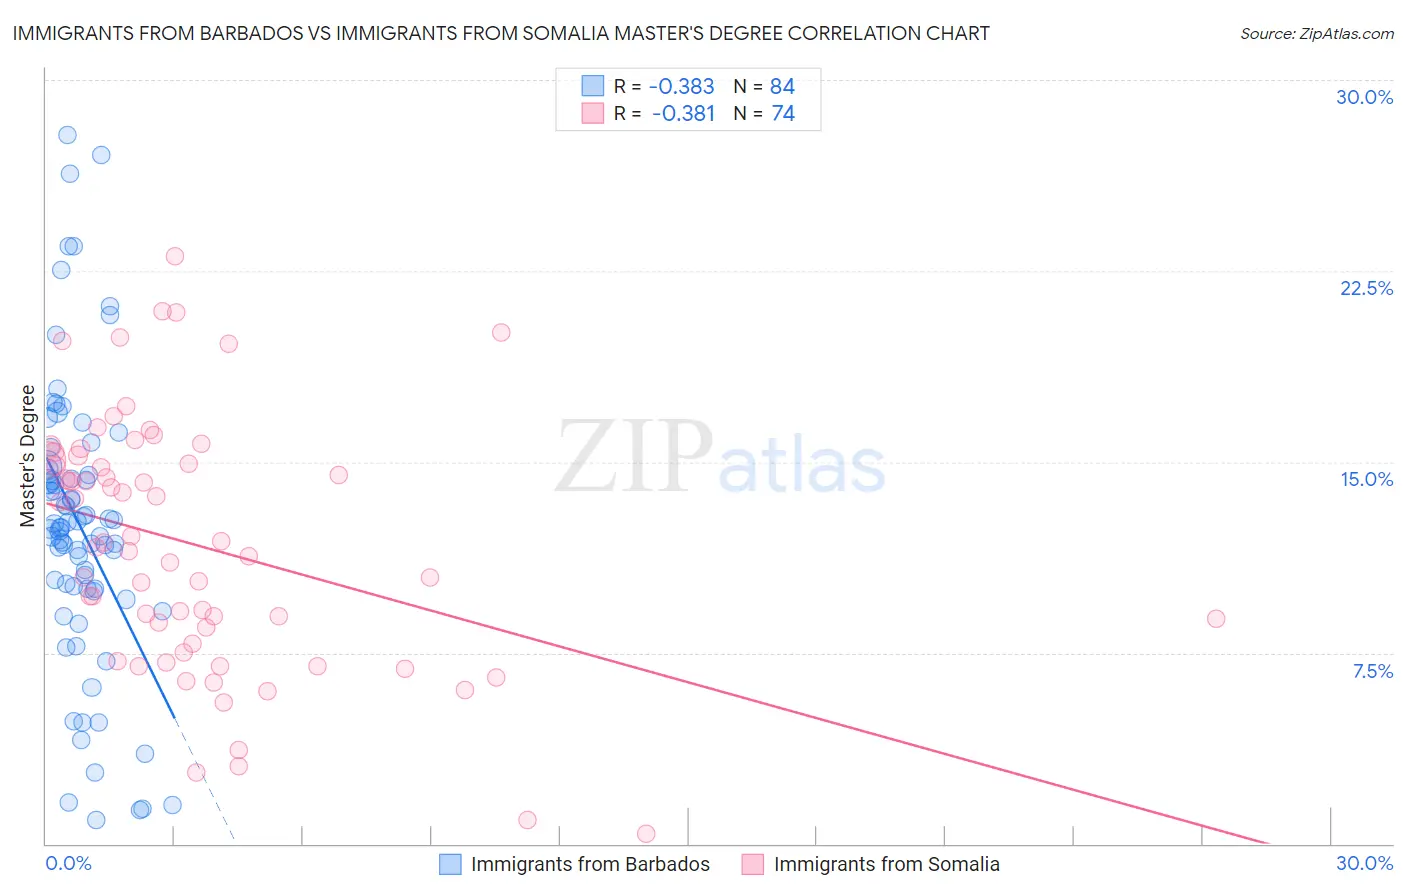
Immigrants from Barbados vs Immigrants from Somalia Master's Degree Correlation Chart
The statistical analysis conducted on geographies consisting of 112,776,866 people shows a mild negative correlation between the proportion of Immigrants from Barbados and percentage of population with at least master's degree education in the United States with a correlation coefficient (R) of -0.383 and weighted average of 14.3%. Similarly, the statistical analysis conducted on geographies consisting of 92,109,960 people shows a mild negative correlation between the proportion of Immigrants from Somalia and percentage of population with at least master's degree education in the United States with a correlation coefficient (R) of -0.381 and weighted average of 14.1%, a difference of 1.1%.
Master's Degree Correlation Summary
| Measurement | Immigrants from Barbados | Immigrants from Somalia |
| Minimum | 0.92% | 0.40% |
| Maximum | 27.8% | 23.1% |
| Range | 26.9% | 22.7% |
| Mean | 12.5% | 11.7% |
| Median | 12.4% | 11.7% |
| Interquartile 25% (IQ1) | 10.0% | 7.9% |
| Interquartile 75% (IQ3) | 14.6% | 15.1% |
| Interquartile Range (IQR) | 4.6% | 7.2% |
| Standard Deviation (Sample) | 5.7% | 4.9% |
| Standard Deviation (Population) | 5.6% | 4.9% |
Demographics Similar to Immigrants from Barbados and Immigrants from Somalia by Master's Degree
In terms of master's degree, the demographic groups most similar to Immigrants from Barbados are Immigrants from Panama (14.3%, a difference of 0.090%), Subsaharan African (14.2%, a difference of 0.22%), Immigrants from Bosnia and Herzegovina (14.3%, a difference of 0.30%), Somali (14.2%, a difference of 0.53%), and Scandinavian (14.4%, a difference of 0.55%). Similarly, the demographic groups most similar to Immigrants from Somalia are Immigrants from Trinidad and Tobago (14.1%, a difference of 0.0%), Immigrants from Vietnam (14.1%, a difference of 0.070%), French Canadian (14.1%, a difference of 0.25%), Finnish (14.2%, a difference of 0.27%), and Immigrants from Thailand (14.2%, a difference of 0.29%).
| Demographics | Rating | Rank | Master's Degree |
| Immigrants | Western Africa | 24.9 /100 | #202 | Fair 14.4% |
| Yugoslavians | 24.3 /100 | #203 | Fair 14.4% |
| French | 23.7 /100 | #204 | Fair 14.4% |
| Trinidadians and Tobagonians | 23.5 /100 | #205 | Fair 14.4% |
| Scandinavians | 23.3 /100 | #206 | Fair 14.4% |
| Immigrants | Bosnia and Herzegovina | 22.0 /100 | #207 | Fair 14.3% |
| Immigrants | Barbados | 20.5 /100 | #208 | Fair 14.3% |
| Immigrants | Panama | 20.0 /100 | #209 | Fair 14.3% |
| Sub-Saharan Africans | 19.4 /100 | #210 | Poor 14.2% |
| Somalis | 18.0 /100 | #211 | Poor 14.2% |
| Spanish | 17.8 /100 | #212 | Poor 14.2% |
| Immigrants | Thailand | 17.0 /100 | #213 | Poor 14.2% |
| Finns | 16.9 /100 | #214 | Poor 14.2% |
| Immigrants | Vietnam | 16.1 /100 | #215 | Poor 14.1% |
| Immigrants | Somalia | 15.8 /100 | #216 | Poor 14.1% |
| Immigrants | Trinidad and Tobago | 15.8 /100 | #217 | Poor 14.1% |
| French Canadians | 14.9 /100 | #218 | Poor 14.1% |
| Norwegians | 13.6 /100 | #219 | Poor 14.0% |
| Germans | 13.1 /100 | #220 | Poor 14.0% |
| Koreans | 12.7 /100 | #221 | Poor 14.0% |
| Ecuadorians | 12.6 /100 | #222 | Poor 14.0% |