Immigrants from Bahamas vs Somali College, 1 year or more
COMPARE
Immigrants from Bahamas
Somali
College, 1 year or more
College, 1 year or more Comparison
Immigrants from Bahamas
Somalis
55.2%
COLLEGE, 1 YEAR OR MORE
0.5/ 100
METRIC RATING
255th/ 347
METRIC RANK
59.9%
COLLEGE, 1 YEAR OR MORE
64.5/ 100
METRIC RATING
161st/ 347
METRIC RANK
Immigrants from Bahamas vs Somali College, 1 year or more Correlation Chart
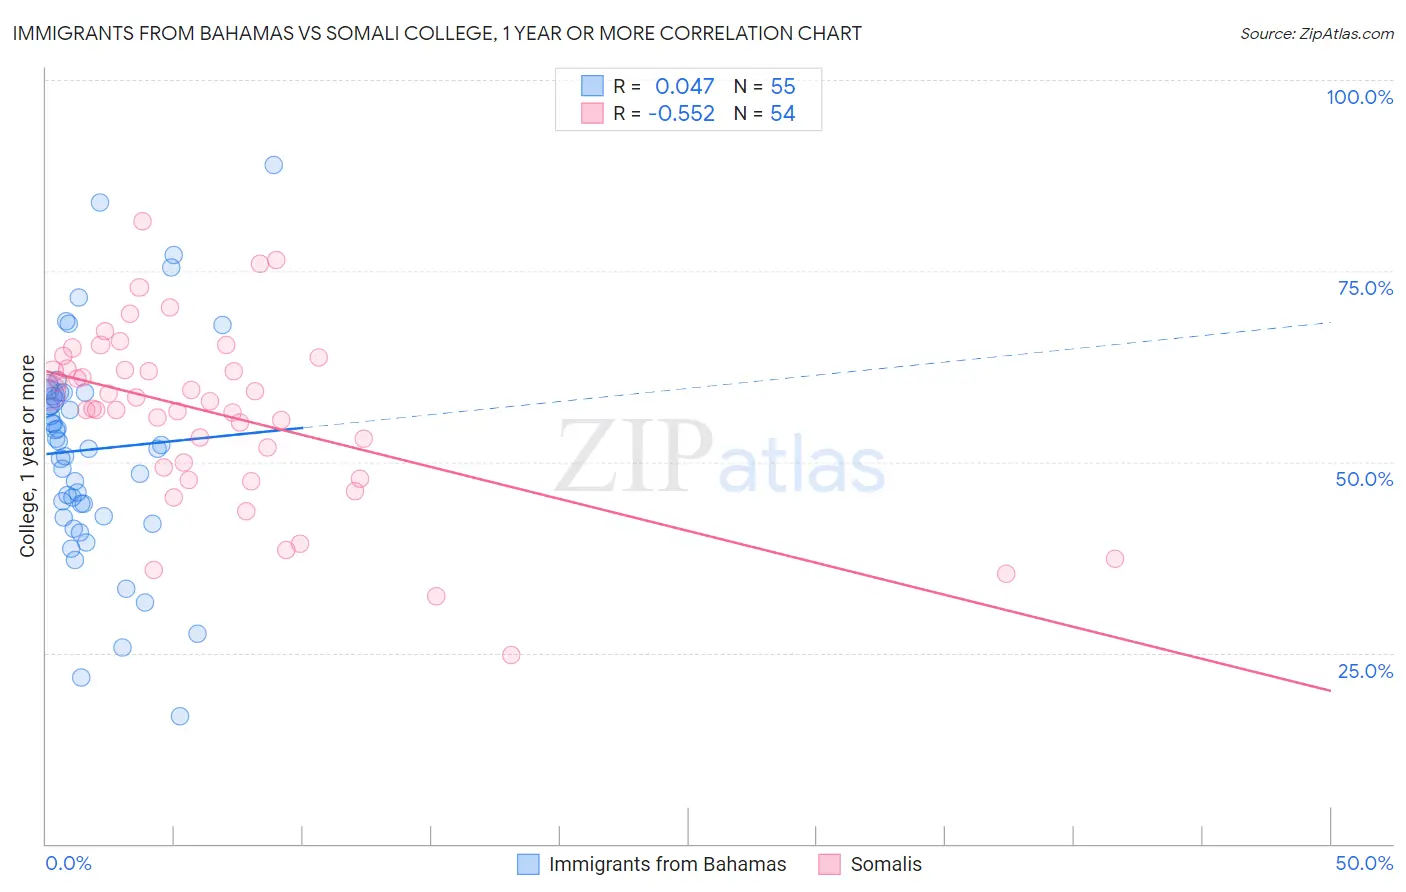
The statistical analysis conducted on geographies consisting of 104,668,341 people shows no correlation between the proportion of Immigrants from Bahamas and percentage of population with at least college, 1 year or more education in the United States with a correlation coefficient (R) of 0.047 and weighted average of 55.2%. Similarly, the statistical analysis conducted on geographies consisting of 99,332,457 people shows a substantial negative correlation between the proportion of Somalis and percentage of population with at least college, 1 year or more education in the United States with a correlation coefficient (R) of -0.552 and weighted average of 59.9%, a difference of 8.5%.
College, 1 year or more Correlation Summary
| Measurement | Immigrants from Bahamas | Somali |
| Minimum | 16.6% | 24.7% |
| Maximum | 88.9% | 81.5% |
| Range | 72.2% | 56.8% |
| Mean | 51.6% | 56.2% |
| Median | 52.3% | 57.4% |
| Interquartile 25% (IQ1) | 42.8% | 49.3% |
| Interquartile 75% (IQ3) | 59.0% | 62.1% |
| Interquartile Range (IQR) | 16.2% | 12.9% |
| Standard Deviation (Sample) | 14.2% | 11.5% |
| Standard Deviation (Population) | 14.1% | 11.4% |
Similar Demographics by College, 1 year or more
Demographics Similar to Immigrants from Bahamas by College, 1 year or more
In terms of college, 1 year or more, the demographic groups most similar to Immigrants from Bahamas are Japanese (55.2%, a difference of 0.050%), Immigrants from West Indies (55.2%, a difference of 0.080%), Indonesian (55.1%, a difference of 0.17%), Immigrants from Barbados (55.4%, a difference of 0.30%), and Aleut (55.4%, a difference of 0.40%).
| Demographics | Rating | Rank | College, 1 year or more |
| Immigrants | Congo | 0.8 /100 | #248 | Tragic 55.6% |
| Immigrants | Trinidad and Tobago | 0.7 /100 | #249 | Tragic 55.5% |
| Delaware | 0.7 /100 | #250 | Tragic 55.5% |
| Immigrants | Cambodia | 0.6 /100 | #251 | Tragic 55.4% |
| Aleuts | 0.6 /100 | #252 | Tragic 55.4% |
| Immigrants | Barbados | 0.6 /100 | #253 | Tragic 55.4% |
| Japanese | 0.5 /100 | #254 | Tragic 55.2% |
| Immigrants | Bahamas | 0.5 /100 | #255 | Tragic 55.2% |
| Immigrants | West Indies | 0.5 /100 | #256 | Tragic 55.2% |
| Indonesians | 0.4 /100 | #257 | Tragic 55.1% |
| Africans | 0.4 /100 | #258 | Tragic 55.0% |
| Nepalese | 0.3 /100 | #259 | Tragic 54.9% |
| Jamaicans | 0.3 /100 | #260 | Tragic 54.9% |
| Ottawa | 0.3 /100 | #261 | Tragic 54.9% |
| Immigrants | St. Vincent and the Grenadines | 0.3 /100 | #262 | Tragic 54.8% |
Demographics Similar to Somalis by College, 1 year or more
In terms of college, 1 year or more, the demographic groups most similar to Somalis are South American Indian (60.0%, a difference of 0.14%), English (60.0%, a difference of 0.15%), Immigrants from Iraq (60.0%, a difference of 0.15%), Immigrants from Armenia (60.0%, a difference of 0.25%), and Korean (59.7%, a difference of 0.34%).
| Demographics | Rating | Rank | College, 1 year or more |
| Sudanese | 73.0 /100 | #154 | Good 60.2% |
| Moroccans | 72.9 /100 | #155 | Good 60.2% |
| Finns | 72.9 /100 | #156 | Good 60.2% |
| Immigrants | Armenia | 68.8 /100 | #157 | Good 60.0% |
| English | 67.2 /100 | #158 | Good 60.0% |
| Immigrants | Iraq | 67.0 /100 | #159 | Good 60.0% |
| South American Indians | 66.9 /100 | #160 | Good 60.0% |
| Somalis | 64.5 /100 | #161 | Good 59.9% |
| Koreans | 58.5 /100 | #162 | Average 59.7% |
| Immigrants | Somalia | 58.3 /100 | #163 | Average 59.7% |
| Belgians | 58.1 /100 | #164 | Average 59.7% |
| Irish | 56.1 /100 | #165 | Average 59.6% |
| Immigrants | Africa | 56.1 /100 | #166 | Average 59.6% |
| Immigrants | North Macedonia | 53.1 /100 | #167 | Average 59.5% |
| Hungarians | 52.9 /100 | #168 | Average 59.5% |