Immigrants from Bahamas vs Bangladeshi College, 1 year or more
COMPARE
Immigrants from Bahamas
Bangladeshi
College, 1 year or more
College, 1 year or more Comparison
Immigrants from Bahamas
Bangladeshis
55.2%
COLLEGE, 1 YEAR OR MORE
0.5/ 100
METRIC RATING
255th/ 347
METRIC RANK
54.5%
COLLEGE, 1 YEAR OR MORE
0.2/ 100
METRIC RATING
269th/ 347
METRIC RANK
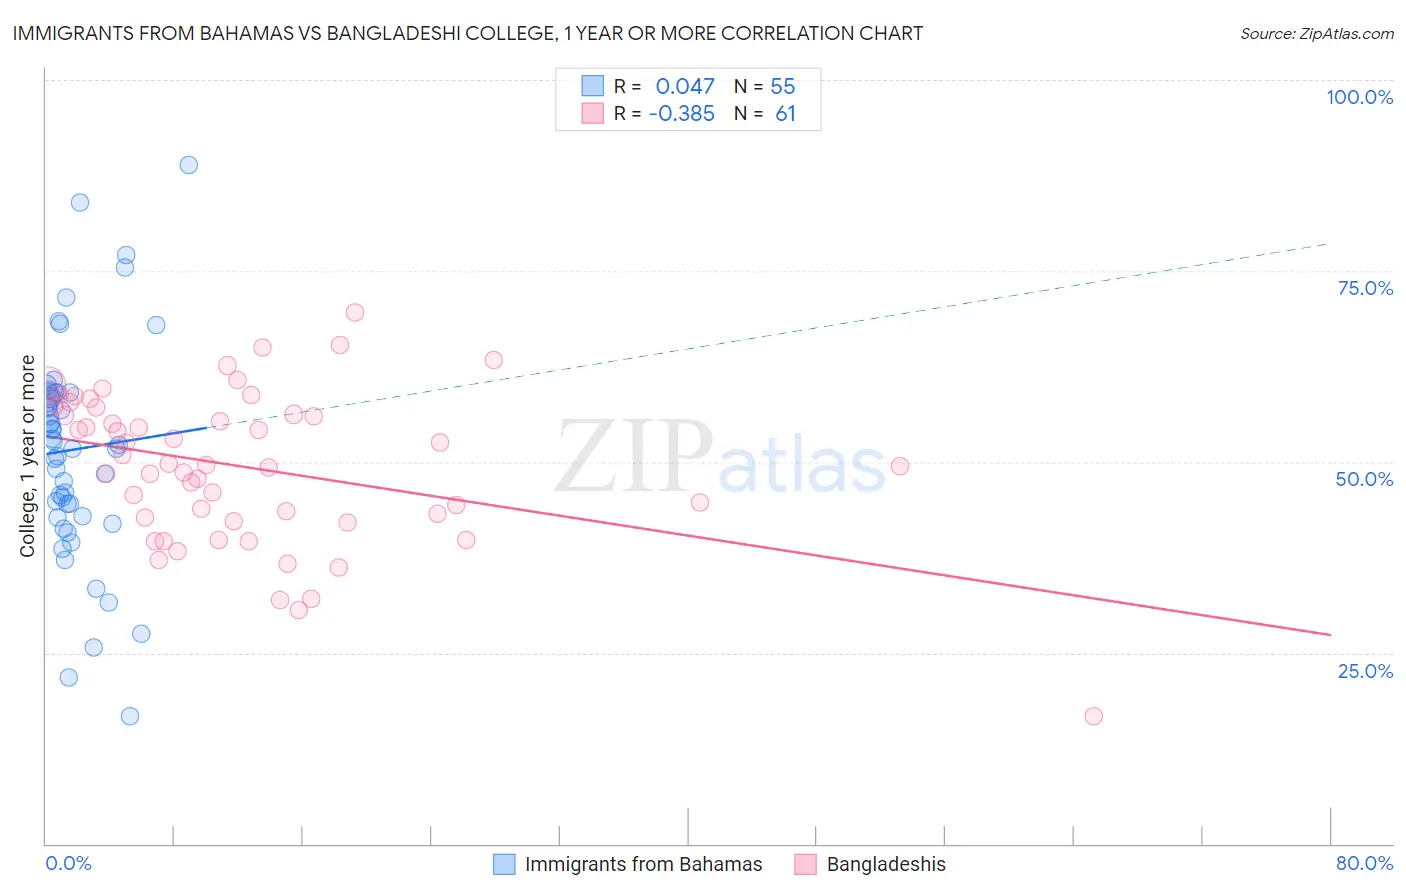
Immigrants from Bahamas vs Bangladeshi College, 1 year or more Correlation Chart
The statistical analysis conducted on geographies consisting of 104,668,341 people shows no correlation between the proportion of Immigrants from Bahamas and percentage of population with at least college, 1 year or more education in the United States with a correlation coefficient (R) of 0.047 and weighted average of 55.2%. Similarly, the statistical analysis conducted on geographies consisting of 141,449,898 people shows a mild negative correlation between the proportion of Bangladeshis and percentage of population with at least college, 1 year or more education in the United States with a correlation coefficient (R) of -0.385 and weighted average of 54.5%, a difference of 1.3%.
College, 1 year or more Correlation Summary
| Measurement | Immigrants from Bahamas | Bangladeshi |
| Minimum | 16.6% | 16.7% |
| Maximum | 88.9% | 69.6% |
| Range | 72.2% | 52.9% |
| Mean | 51.6% | 49.3% |
| Median | 52.3% | 49.6% |
| Interquartile 25% (IQ1) | 42.8% | 42.4% |
| Interquartile 75% (IQ3) | 59.0% | 56.6% |
| Interquartile Range (IQR) | 16.2% | 14.2% |
| Standard Deviation (Sample) | 14.2% | 10.0% |
| Standard Deviation (Population) | 14.1% | 9.9% |
Demographics Similar to Immigrants from Bahamas and Bangladeshis by College, 1 year or more
In terms of college, 1 year or more, the demographic groups most similar to Immigrants from Bahamas are Japanese (55.2%, a difference of 0.050%), Immigrants from West Indies (55.2%, a difference of 0.080%), Indonesian (55.1%, a difference of 0.17%), Immigrants from Barbados (55.4%, a difference of 0.30%), and Aleut (55.4%, a difference of 0.40%). Similarly, the demographic groups most similar to Bangladeshis are British West Indian (54.5%, a difference of 0.030%), Crow (54.5%, a difference of 0.030%), Bahamian (54.5%, a difference of 0.060%), Comanche (54.4%, a difference of 0.10%), and Blackfeet (54.6%, a difference of 0.19%).
| Demographics | Rating | Rank | College, 1 year or more |
| Aleuts | 0.6 /100 | #252 | Tragic 55.4% |
| Immigrants | Barbados | 0.6 /100 | #253 | Tragic 55.4% |
| Japanese | 0.5 /100 | #254 | Tragic 55.2% |
| Immigrants | Bahamas | 0.5 /100 | #255 | Tragic 55.2% |
| Immigrants | West Indies | 0.5 /100 | #256 | Tragic 55.2% |
| Indonesians | 0.4 /100 | #257 | Tragic 55.1% |
| Africans | 0.4 /100 | #258 | Tragic 55.0% |
| Nepalese | 0.3 /100 | #259 | Tragic 54.9% |
| Jamaicans | 0.3 /100 | #260 | Tragic 54.9% |
| Ottawa | 0.3 /100 | #261 | Tragic 54.9% |
| Immigrants | St. Vincent and the Grenadines | 0.3 /100 | #262 | Tragic 54.8% |
| U.S. Virgin Islanders | 0.3 /100 | #263 | Tragic 54.8% |
| Immigrants | Micronesia | 0.3 /100 | #264 | Tragic 54.8% |
| Immigrants | Laos | 0.2 /100 | #265 | Tragic 54.7% |
| Potawatomi | 0.2 /100 | #266 | Tragic 54.6% |
| Blackfeet | 0.2 /100 | #267 | Tragic 54.6% |
| British West Indians | 0.2 /100 | #268 | Tragic 54.5% |
| Bangladeshis | 0.2 /100 | #269 | Tragic 54.5% |
| Crow | 0.2 /100 | #270 | Tragic 54.5% |
| Bahamians | 0.2 /100 | #271 | Tragic 54.5% |
| Comanche | 0.2 /100 | #272 | Tragic 54.4% |