Immigrants from Fiji vs Somali College, 1 year or more
COMPARE
Immigrants from Fiji
Somali
College, 1 year or more
College, 1 year or more Comparison
Immigrants from Fiji
Somalis
56.9%
COLLEGE, 1 YEAR OR MORE
4.0/ 100
METRIC RATING
228th/ 347
METRIC RANK
59.9%
COLLEGE, 1 YEAR OR MORE
64.5/ 100
METRIC RATING
161st/ 347
METRIC RANK
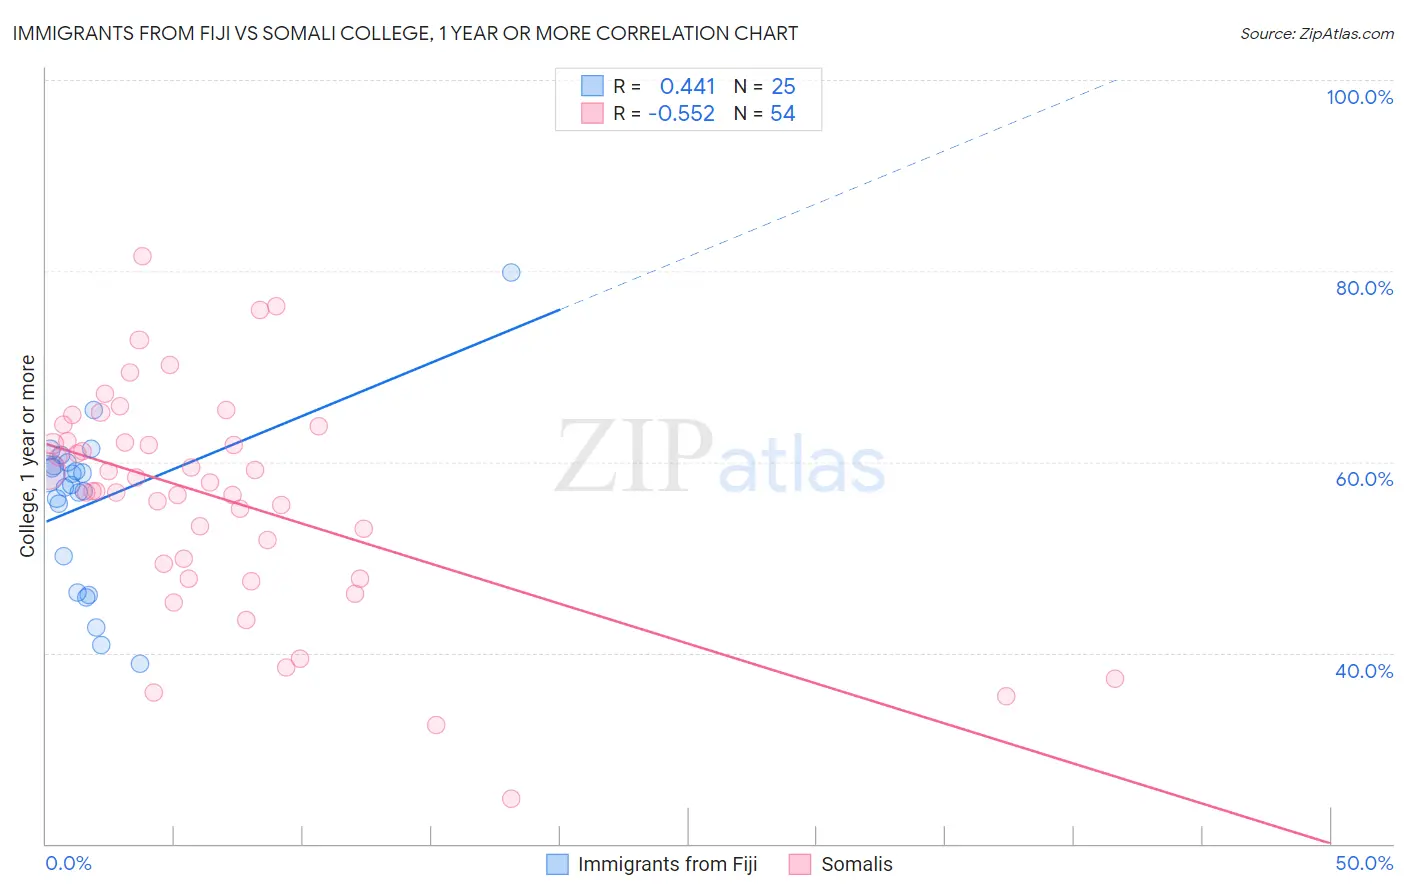
Immigrants from Fiji vs Somali College, 1 year or more Correlation Chart
The statistical analysis conducted on geographies consisting of 93,755,737 people shows a moderate positive correlation between the proportion of Immigrants from Fiji and percentage of population with at least college, 1 year or more education in the United States with a correlation coefficient (R) of 0.441 and weighted average of 56.9%. Similarly, the statistical analysis conducted on geographies consisting of 99,332,457 people shows a substantial negative correlation between the proportion of Somalis and percentage of population with at least college, 1 year or more education in the United States with a correlation coefficient (R) of -0.552 and weighted average of 59.9%, a difference of 5.2%.
College, 1 year or more Correlation Summary
| Measurement | Immigrants from Fiji | Somali |
| Minimum | 38.9% | 24.7% |
| Maximum | 79.8% | 81.5% |
| Range | 40.9% | 56.8% |
| Mean | 55.8% | 56.2% |
| Median | 57.5% | 57.4% |
| Interquartile 25% (IQ1) | 48.2% | 49.3% |
| Interquartile 75% (IQ3) | 59.8% | 62.1% |
| Interquartile Range (IQR) | 11.5% | 12.9% |
| Standard Deviation (Sample) | 8.8% | 11.5% |
| Standard Deviation (Population) | 8.6% | 11.4% |
Similar Demographics by College, 1 year or more
Demographics Similar to Immigrants from Fiji by College, 1 year or more
In terms of college, 1 year or more, the demographic groups most similar to Immigrants from Fiji are Cree (56.8%, a difference of 0.13%), Immigrants (57.0%, a difference of 0.15%), Immigrants from Western Africa (57.0%, a difference of 0.21%), Vietnamese (57.0%, a difference of 0.24%), and Liberian (56.7%, a difference of 0.35%).
| Demographics | Rating | Rank | College, 1 year or more |
| Immigrants | Ghana | 7.7 /100 | #221 | Tragic 57.4% |
| Sub-Saharan Africans | 6.1 /100 | #222 | Tragic 57.3% |
| Portuguese | 5.4 /100 | #223 | Tragic 57.2% |
| Hmong | 5.4 /100 | #224 | Tragic 57.2% |
| Vietnamese | 4.7 /100 | #225 | Tragic 57.0% |
| Immigrants | Western Africa | 4.6 /100 | #226 | Tragic 57.0% |
| Immigrants | Immigrants | 4.4 /100 | #227 | Tragic 57.0% |
| Immigrants | Fiji | 4.0 /100 | #228 | Tragic 56.9% |
| Cree | 3.6 /100 | #229 | Tragic 56.8% |
| Liberians | 3.1 /100 | #230 | Tragic 56.7% |
| Immigrants | Burma/Myanmar | 2.7 /100 | #231 | Tragic 56.6% |
| Immigrants | Bangladesh | 2.6 /100 | #232 | Tragic 56.6% |
| Immigrants | Nonimmigrants | 2.5 /100 | #233 | Tragic 56.5% |
| Spanish Americans | 1.8 /100 | #234 | Tragic 56.3% |
| West Indians | 1.8 /100 | #235 | Tragic 56.3% |
Demographics Similar to Somalis by College, 1 year or more
In terms of college, 1 year or more, the demographic groups most similar to Somalis are South American Indian (60.0%, a difference of 0.14%), English (60.0%, a difference of 0.15%), Immigrants from Iraq (60.0%, a difference of 0.15%), Immigrants from Armenia (60.0%, a difference of 0.25%), and Korean (59.7%, a difference of 0.34%).
| Demographics | Rating | Rank | College, 1 year or more |
| Sudanese | 73.0 /100 | #154 | Good 60.2% |
| Moroccans | 72.9 /100 | #155 | Good 60.2% |
| Finns | 72.9 /100 | #156 | Good 60.2% |
| Immigrants | Armenia | 68.8 /100 | #157 | Good 60.0% |
| English | 67.2 /100 | #158 | Good 60.0% |
| Immigrants | Iraq | 67.0 /100 | #159 | Good 60.0% |
| South American Indians | 66.9 /100 | #160 | Good 60.0% |
| Somalis | 64.5 /100 | #161 | Good 59.9% |
| Koreans | 58.5 /100 | #162 | Average 59.7% |
| Immigrants | Somalia | 58.3 /100 | #163 | Average 59.7% |
| Belgians | 58.1 /100 | #164 | Average 59.7% |
| Irish | 56.1 /100 | #165 | Average 59.6% |
| Immigrants | Africa | 56.1 /100 | #166 | Average 59.6% |
| Immigrants | North Macedonia | 53.1 /100 | #167 | Average 59.5% |
| Hungarians | 52.9 /100 | #168 | Average 59.5% |