Immigrants from Bahamas vs Immigrants from Vietnam College, 1 year or more
COMPARE
Immigrants from Bahamas
Immigrants from Vietnam
College, 1 year or more
College, 1 year or more Comparison
Immigrants from Bahamas
Immigrants from Vietnam
55.2%
COLLEGE, 1 YEAR OR MORE
0.5/ 100
METRIC RATING
255th/ 347
METRIC RANK
58.2%
COLLEGE, 1 YEAR OR MORE
18.2/ 100
METRIC RATING
206th/ 347
METRIC RANK
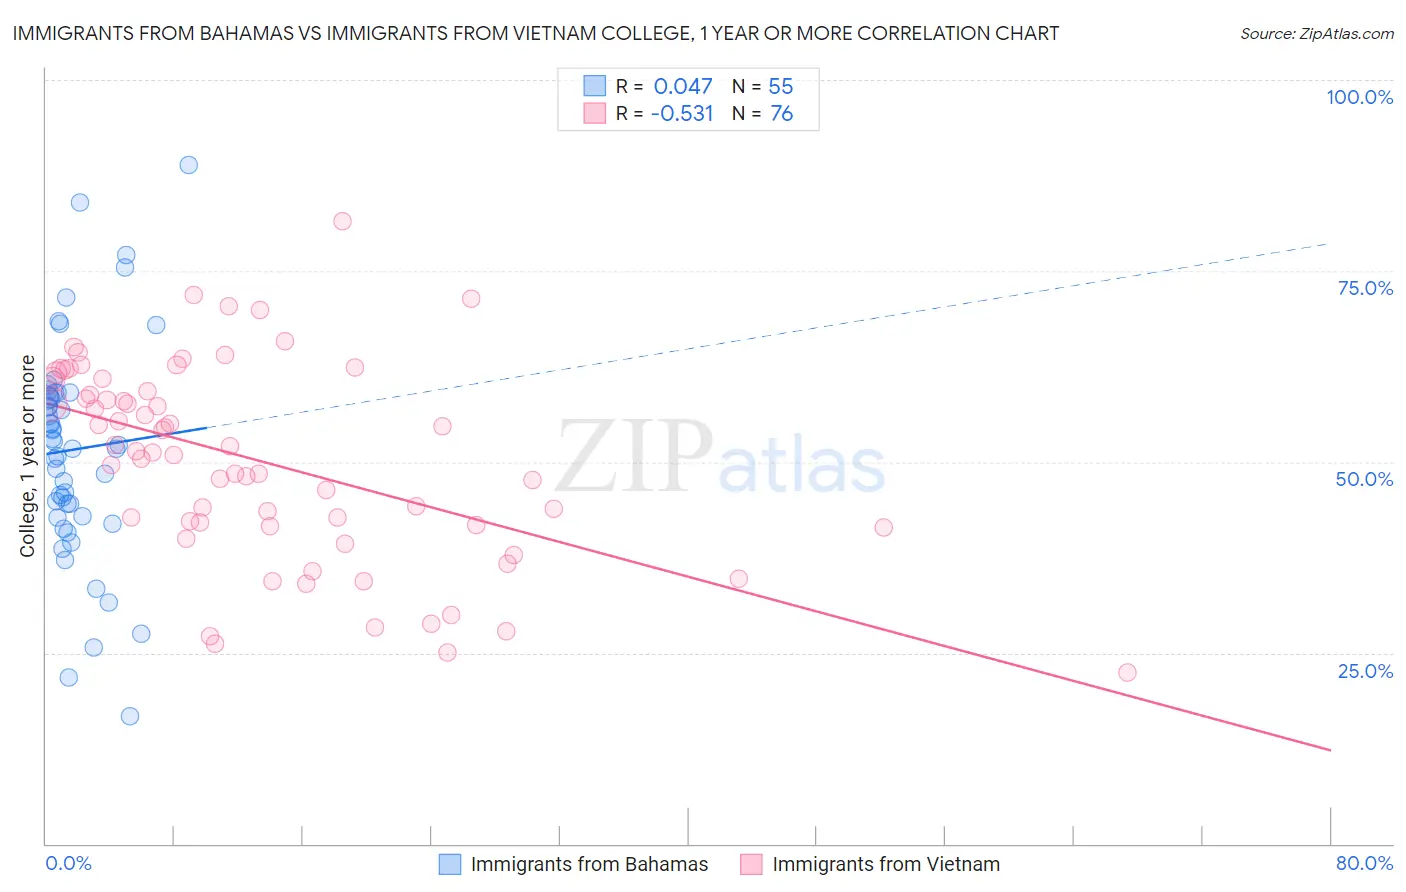
Immigrants from Bahamas vs Immigrants from Vietnam College, 1 year or more Correlation Chart
The statistical analysis conducted on geographies consisting of 104,668,341 people shows no correlation between the proportion of Immigrants from Bahamas and percentage of population with at least college, 1 year or more education in the United States with a correlation coefficient (R) of 0.047 and weighted average of 55.2%. Similarly, the statistical analysis conducted on geographies consisting of 404,840,629 people shows a substantial negative correlation between the proportion of Immigrants from Vietnam and percentage of population with at least college, 1 year or more education in the United States with a correlation coefficient (R) of -0.531 and weighted average of 58.2%, a difference of 5.5%.
College, 1 year or more Correlation Summary
| Measurement | Immigrants from Bahamas | Immigrants from Vietnam |
| Minimum | 16.6% | 22.4% |
| Maximum | 88.9% | 81.5% |
| Range | 72.2% | 59.1% |
| Mean | 51.6% | 50.1% |
| Median | 52.3% | 51.3% |
| Interquartile 25% (IQ1) | 42.8% | 41.6% |
| Interquartile 75% (IQ3) | 59.0% | 60.0% |
| Interquartile Range (IQR) | 16.2% | 18.4% |
| Standard Deviation (Sample) | 14.2% | 12.9% |
| Standard Deviation (Population) | 14.1% | 12.8% |
Similar Demographics by College, 1 year or more
Demographics Similar to Immigrants from Bahamas by College, 1 year or more
In terms of college, 1 year or more, the demographic groups most similar to Immigrants from Bahamas are Japanese (55.2%, a difference of 0.050%), Immigrants from West Indies (55.2%, a difference of 0.080%), Indonesian (55.1%, a difference of 0.17%), Immigrants from Barbados (55.4%, a difference of 0.30%), and Aleut (55.4%, a difference of 0.40%).
| Demographics | Rating | Rank | College, 1 year or more |
| Immigrants | Congo | 0.8 /100 | #248 | Tragic 55.6% |
| Immigrants | Trinidad and Tobago | 0.7 /100 | #249 | Tragic 55.5% |
| Delaware | 0.7 /100 | #250 | Tragic 55.5% |
| Immigrants | Cambodia | 0.6 /100 | #251 | Tragic 55.4% |
| Aleuts | 0.6 /100 | #252 | Tragic 55.4% |
| Immigrants | Barbados | 0.6 /100 | #253 | Tragic 55.4% |
| Japanese | 0.5 /100 | #254 | Tragic 55.2% |
| Immigrants | Bahamas | 0.5 /100 | #255 | Tragic 55.2% |
| Immigrants | West Indies | 0.5 /100 | #256 | Tragic 55.2% |
| Indonesians | 0.4 /100 | #257 | Tragic 55.1% |
| Africans | 0.4 /100 | #258 | Tragic 55.0% |
| Nepalese | 0.3 /100 | #259 | Tragic 54.9% |
| Jamaicans | 0.3 /100 | #260 | Tragic 54.9% |
| Ottawa | 0.3 /100 | #261 | Tragic 54.9% |
| Immigrants | St. Vincent and the Grenadines | 0.3 /100 | #262 | Tragic 54.8% |
Demographics Similar to Immigrants from Vietnam by College, 1 year or more
In terms of college, 1 year or more, the demographic groups most similar to Immigrants from Vietnam are Immigrants from Zaire (58.3%, a difference of 0.040%), Panamanian (58.3%, a difference of 0.090%), Senegalese (58.2%, a difference of 0.12%), Ghanaian (58.4%, a difference of 0.23%), and Immigrants from Uruguay (58.1%, a difference of 0.29%).
| Demographics | Rating | Rank | College, 1 year or more |
| Slovaks | 24.6 /100 | #199 | Fair 58.5% |
| Spanish | 24.2 /100 | #200 | Fair 58.5% |
| Nigerians | 23.0 /100 | #201 | Fair 58.5% |
| Immigrants | South America | 21.9 /100 | #202 | Fair 58.4% |
| Ghanaians | 20.9 /100 | #203 | Fair 58.4% |
| Panamanians | 19.2 /100 | #204 | Poor 58.3% |
| Immigrants | Zaire | 18.7 /100 | #205 | Poor 58.3% |
| Immigrants | Vietnam | 18.2 /100 | #206 | Poor 58.2% |
| Senegalese | 16.9 /100 | #207 | Poor 58.2% |
| Immigrants | Uruguay | 15.2 /100 | #208 | Poor 58.1% |
| Immigrants | Middle Africa | 14.0 /100 | #209 | Poor 58.0% |
| Tsimshian | 13.5 /100 | #210 | Poor 57.9% |
| Immigrants | Nigeria | 13.3 /100 | #211 | Poor 57.9% |
| Immigrants | Senegal | 11.8 /100 | #212 | Poor 57.8% |
| French Canadians | 11.8 /100 | #213 | Poor 57.8% |