Immigrants from Bahamas vs Belgian College, 1 year or more
COMPARE
Immigrants from Bahamas
Belgian
College, 1 year or more
College, 1 year or more Comparison
Immigrants from Bahamas
Belgians
55.2%
COLLEGE, 1 YEAR OR MORE
0.5/ 100
METRIC RATING
255th/ 347
METRIC RANK
59.7%
COLLEGE, 1 YEAR OR MORE
58.1/ 100
METRIC RATING
164th/ 347
METRIC RANK
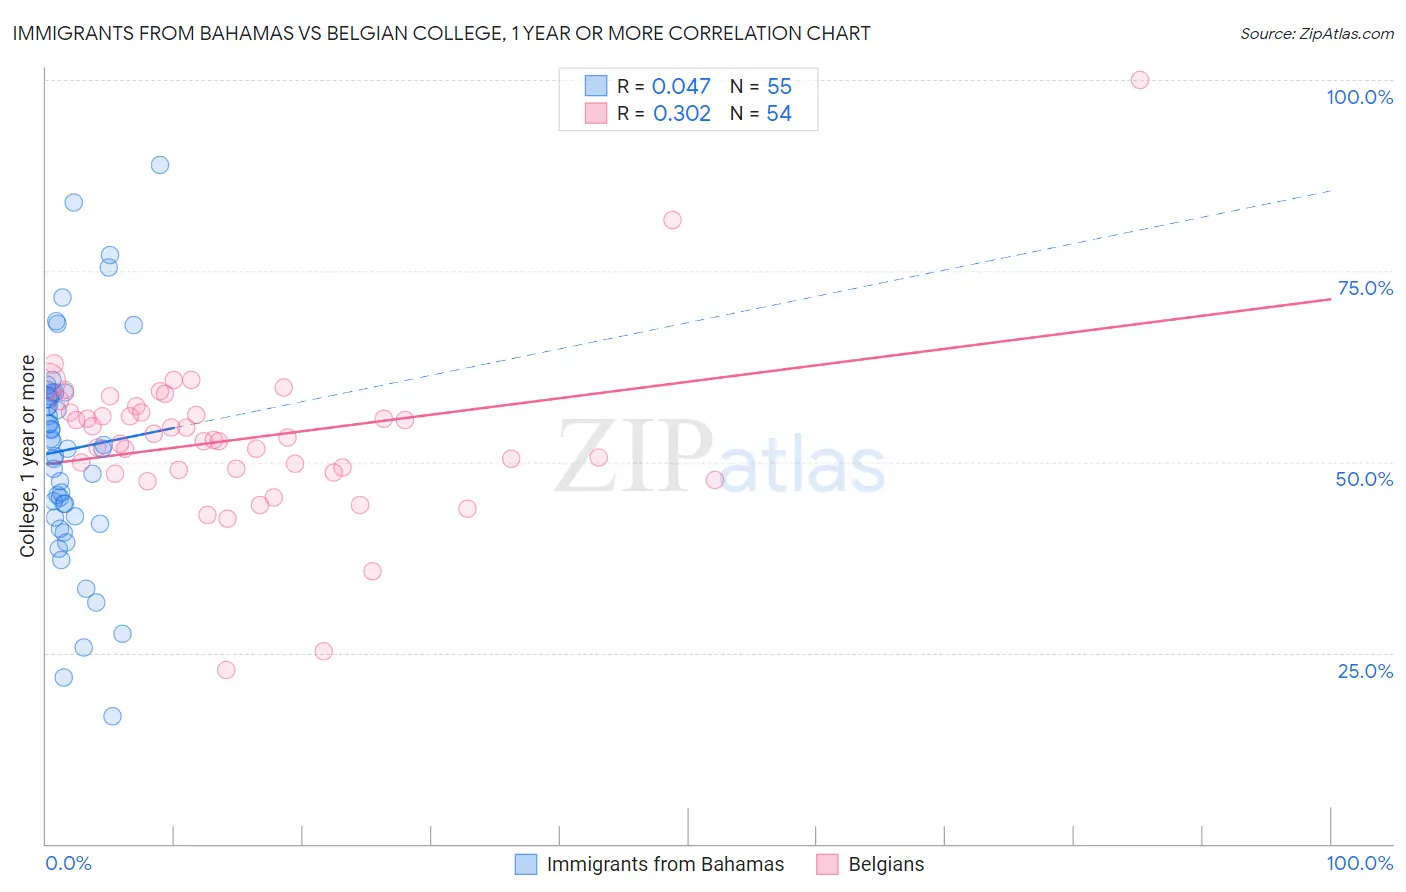
Immigrants from Bahamas vs Belgian College, 1 year or more Correlation Chart
The statistical analysis conducted on geographies consisting of 104,668,341 people shows no correlation between the proportion of Immigrants from Bahamas and percentage of population with at least college, 1 year or more education in the United States with a correlation coefficient (R) of 0.047 and weighted average of 55.2%. Similarly, the statistical analysis conducted on geographies consisting of 356,017,497 people shows a mild positive correlation between the proportion of Belgians and percentage of population with at least college, 1 year or more education in the United States with a correlation coefficient (R) of 0.302 and weighted average of 59.7%, a difference of 8.1%.
College, 1 year or more Correlation Summary
| Measurement | Immigrants from Bahamas | Belgian |
| Minimum | 16.6% | 22.8% |
| Maximum | 88.9% | 100.0% |
| Range | 72.2% | 77.2% |
| Mean | 51.6% | 53.1% |
| Median | 52.3% | 53.0% |
| Interquartile 25% (IQ1) | 42.8% | 48.9% |
| Interquartile 75% (IQ3) | 59.0% | 56.4% |
| Interquartile Range (IQR) | 16.2% | 7.6% |
| Standard Deviation (Sample) | 14.2% | 10.9% |
| Standard Deviation (Population) | 14.1% | 10.8% |
Similar Demographics by College, 1 year or more
Demographics Similar to Immigrants from Bahamas by College, 1 year or more
In terms of college, 1 year or more, the demographic groups most similar to Immigrants from Bahamas are Japanese (55.2%, a difference of 0.050%), Immigrants from West Indies (55.2%, a difference of 0.080%), Indonesian (55.1%, a difference of 0.17%), Immigrants from Barbados (55.4%, a difference of 0.30%), and Aleut (55.4%, a difference of 0.40%).
| Demographics | Rating | Rank | College, 1 year or more |
| Immigrants | Congo | 0.8 /100 | #248 | Tragic 55.6% |
| Immigrants | Trinidad and Tobago | 0.7 /100 | #249 | Tragic 55.5% |
| Delaware | 0.7 /100 | #250 | Tragic 55.5% |
| Immigrants | Cambodia | 0.6 /100 | #251 | Tragic 55.4% |
| Aleuts | 0.6 /100 | #252 | Tragic 55.4% |
| Immigrants | Barbados | 0.6 /100 | #253 | Tragic 55.4% |
| Japanese | 0.5 /100 | #254 | Tragic 55.2% |
| Immigrants | Bahamas | 0.5 /100 | #255 | Tragic 55.2% |
| Immigrants | West Indies | 0.5 /100 | #256 | Tragic 55.2% |
| Indonesians | 0.4 /100 | #257 | Tragic 55.1% |
| Africans | 0.4 /100 | #258 | Tragic 55.0% |
| Nepalese | 0.3 /100 | #259 | Tragic 54.9% |
| Jamaicans | 0.3 /100 | #260 | Tragic 54.9% |
| Ottawa | 0.3 /100 | #261 | Tragic 54.9% |
| Immigrants | St. Vincent and the Grenadines | 0.3 /100 | #262 | Tragic 54.8% |
Demographics Similar to Belgians by College, 1 year or more
In terms of college, 1 year or more, the demographic groups most similar to Belgians are Immigrants from Somalia (59.7%, a difference of 0.010%), Korean (59.7%, a difference of 0.020%), Irish (59.6%, a difference of 0.11%), Immigrants from Africa (59.6%, a difference of 0.11%), and Immigrants from North Macedonia (59.5%, a difference of 0.27%).
| Demographics | Rating | Rank | College, 1 year or more |
| Immigrants | Armenia | 68.8 /100 | #157 | Good 60.0% |
| English | 67.2 /100 | #158 | Good 60.0% |
| Immigrants | Iraq | 67.0 /100 | #159 | Good 60.0% |
| South American Indians | 66.9 /100 | #160 | Good 60.0% |
| Somalis | 64.5 /100 | #161 | Good 59.9% |
| Koreans | 58.5 /100 | #162 | Average 59.7% |
| Immigrants | Somalia | 58.3 /100 | #163 | Average 59.7% |
| Belgians | 58.1 /100 | #164 | Average 59.7% |
| Irish | 56.1 /100 | #165 | Average 59.6% |
| Immigrants | Africa | 56.1 /100 | #166 | Average 59.6% |
| Immigrants | North Macedonia | 53.1 /100 | #167 | Average 59.5% |
| Hungarians | 52.9 /100 | #168 | Average 59.5% |
| Immigrants | Southern Europe | 52.7 /100 | #169 | Average 59.5% |
| Welsh | 52.4 /100 | #170 | Average 59.5% |
| Immigrants | Albania | 52.3 /100 | #171 | Average 59.5% |