Immigrants from Bahamas vs Immigrants from Cabo Verde College, 1 year or more
COMPARE
Immigrants from Bahamas
Immigrants from Cabo Verde
College, 1 year or more
College, 1 year or more Comparison
Immigrants from Bahamas
Immigrants from Cabo Verde
55.2%
COLLEGE, 1 YEAR OR MORE
0.5/ 100
METRIC RATING
255th/ 347
METRIC RANK
48.1%
COLLEGE, 1 YEAR OR MORE
0.0/ 100
METRIC RATING
340th/ 347
METRIC RANK
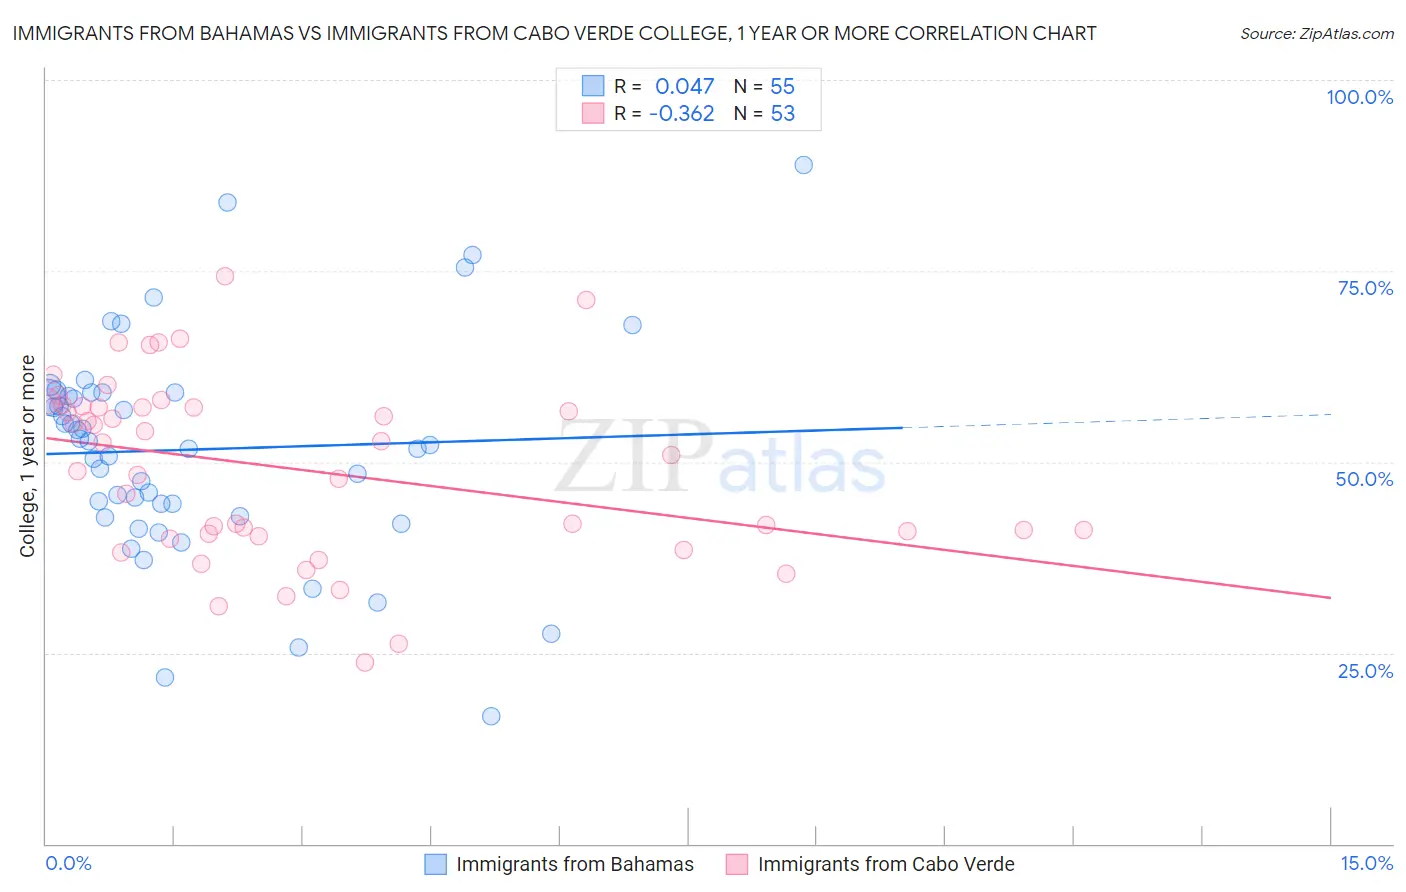
Immigrants from Bahamas vs Immigrants from Cabo Verde College, 1 year or more Correlation Chart
The statistical analysis conducted on geographies consisting of 104,668,341 people shows no correlation between the proportion of Immigrants from Bahamas and percentage of population with at least college, 1 year or more education in the United States with a correlation coefficient (R) of 0.047 and weighted average of 55.2%. Similarly, the statistical analysis conducted on geographies consisting of 38,158,666 people shows a mild negative correlation between the proportion of Immigrants from Cabo Verde and percentage of population with at least college, 1 year or more education in the United States with a correlation coefficient (R) of -0.362 and weighted average of 48.1%, a difference of 14.8%.
College, 1 year or more Correlation Summary
| Measurement | Immigrants from Bahamas | Immigrants from Cabo Verde |
| Minimum | 16.6% | 23.7% |
| Maximum | 88.9% | 74.3% |
| Range | 72.2% | 50.5% |
| Mean | 51.6% | 49.1% |
| Median | 52.3% | 51.0% |
| Interquartile 25% (IQ1) | 42.8% | 40.4% |
| Interquartile 75% (IQ3) | 59.0% | 57.2% |
| Interquartile Range (IQR) | 16.2% | 16.8% |
| Standard Deviation (Sample) | 14.2% | 11.7% |
| Standard Deviation (Population) | 14.1% | 11.6% |
Similar Demographics by College, 1 year or more
Demographics Similar to Immigrants from Bahamas by College, 1 year or more
In terms of college, 1 year or more, the demographic groups most similar to Immigrants from Bahamas are Japanese (55.2%, a difference of 0.050%), Immigrants from West Indies (55.2%, a difference of 0.080%), Indonesian (55.1%, a difference of 0.17%), Immigrants from Barbados (55.4%, a difference of 0.30%), and Aleut (55.4%, a difference of 0.40%).
| Demographics | Rating | Rank | College, 1 year or more |
| Immigrants | Congo | 0.8 /100 | #248 | Tragic 55.6% |
| Immigrants | Trinidad and Tobago | 0.7 /100 | #249 | Tragic 55.5% |
| Delaware | 0.7 /100 | #250 | Tragic 55.5% |
| Immigrants | Cambodia | 0.6 /100 | #251 | Tragic 55.4% |
| Aleuts | 0.6 /100 | #252 | Tragic 55.4% |
| Immigrants | Barbados | 0.6 /100 | #253 | Tragic 55.4% |
| Japanese | 0.5 /100 | #254 | Tragic 55.2% |
| Immigrants | Bahamas | 0.5 /100 | #255 | Tragic 55.2% |
| Immigrants | West Indies | 0.5 /100 | #256 | Tragic 55.2% |
| Indonesians | 0.4 /100 | #257 | Tragic 55.1% |
| Africans | 0.4 /100 | #258 | Tragic 55.0% |
| Nepalese | 0.3 /100 | #259 | Tragic 54.9% |
| Jamaicans | 0.3 /100 | #260 | Tragic 54.9% |
| Ottawa | 0.3 /100 | #261 | Tragic 54.9% |
| Immigrants | St. Vincent and the Grenadines | 0.3 /100 | #262 | Tragic 54.8% |
Demographics Similar to Immigrants from Cabo Verde by College, 1 year or more
In terms of college, 1 year or more, the demographic groups most similar to Immigrants from Cabo Verde are Immigrants from the Azores (48.4%, a difference of 0.57%), Immigrants from Central America (48.5%, a difference of 0.83%), Pennsylvania German (48.5%, a difference of 0.88%), Spanish American Indian (48.5%, a difference of 0.89%), and Immigrants from Mexico (47.5%, a difference of 1.2%).
| Demographics | Rating | Rank | College, 1 year or more |
| Immigrants | Dominican Republic | 0.0 /100 | #333 | Tragic 49.1% |
| Lumbee | 0.0 /100 | #334 | Tragic 48.9% |
| Yuman | 0.0 /100 | #335 | Tragic 48.7% |
| Spanish American Indians | 0.0 /100 | #336 | Tragic 48.5% |
| Pennsylvania Germans | 0.0 /100 | #337 | Tragic 48.5% |
| Immigrants | Central America | 0.0 /100 | #338 | Tragic 48.5% |
| Immigrants | Azores | 0.0 /100 | #339 | Tragic 48.4% |
| Immigrants | Cabo Verde | 0.0 /100 | #340 | Tragic 48.1% |
| Immigrants | Mexico | 0.0 /100 | #341 | Tragic 47.5% |
| Inupiat | 0.0 /100 | #342 | Tragic 47.2% |
| Tohono O'odham | 0.0 /100 | #343 | Tragic 47.1% |
| Yakama | 0.0 /100 | #344 | Tragic 46.2% |
| Pima | 0.0 /100 | #345 | Tragic 45.6% |
| Houma | 0.0 /100 | #346 | Tragic 41.2% |
| Yup'ik | 0.0 /100 | #347 | Tragic 39.4% |