Immigrants from Bahamas vs Immigrants from Ireland Doctorate Degree
COMPARE
Immigrants from Bahamas
Immigrants from Ireland
Doctorate Degree
Doctorate Degree Comparison
Immigrants from Bahamas
Immigrants from Ireland
1.5%
DOCTORATE DEGREE
0.7/ 100
METRIC RATING
263rd/ 347
METRIC RANK
2.5%
DOCTORATE DEGREE
100.0/ 100
METRIC RATING
39th/ 347
METRIC RANK
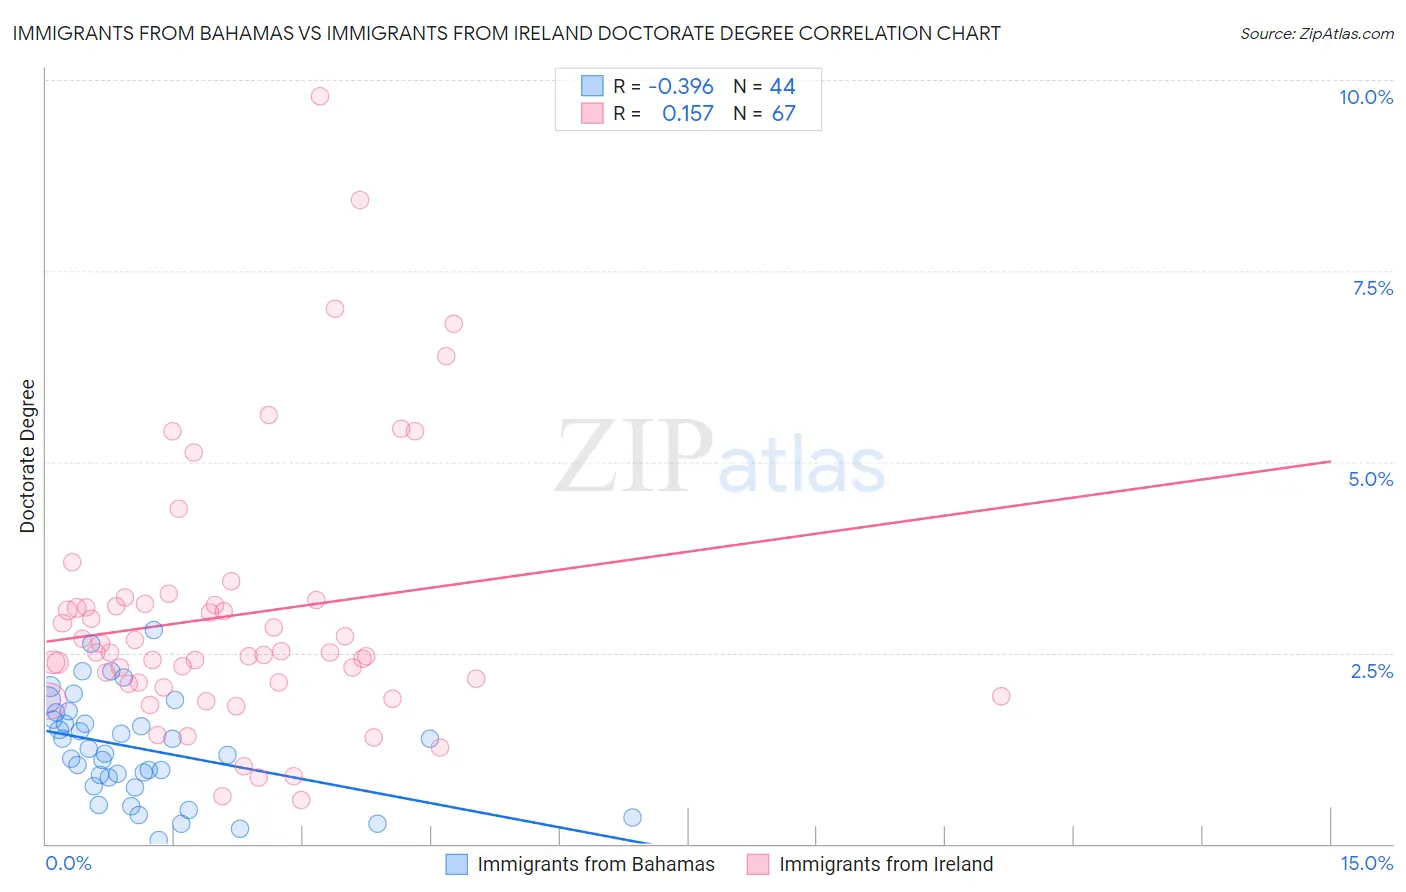
Immigrants from Bahamas vs Immigrants from Ireland Doctorate Degree Correlation Chart
The statistical analysis conducted on geographies consisting of 104,472,552 people shows a mild negative correlation between the proportion of Immigrants from Bahamas and percentage of population with at least doctorate degree education in the United States with a correlation coefficient (R) of -0.396 and weighted average of 1.5%. Similarly, the statistical analysis conducted on geographies consisting of 240,028,827 people shows a poor positive correlation between the proportion of Immigrants from Ireland and percentage of population with at least doctorate degree education in the United States with a correlation coefficient (R) of 0.157 and weighted average of 2.5%, a difference of 68.5%.
Doctorate Degree Correlation Summary
| Measurement | Immigrants from Bahamas | Immigrants from Ireland |
| Minimum | 0.056% | 0.58% |
| Maximum | 2.8% | 9.8% |
| Range | 2.7% | 9.2% |
| Mean | 1.2% | 3.0% |
| Median | 1.2% | 2.5% |
| Interquartile 25% (IQ1) | 0.80% | 2.1% |
| Interquartile 75% (IQ3) | 1.7% | 3.1% |
| Interquartile Range (IQR) | 0.87% | 1.0% |
| Standard Deviation (Sample) | 0.67% | 1.8% |
| Standard Deviation (Population) | 0.66% | 1.7% |
Similar Demographics by Doctorate Degree
Demographics Similar to Immigrants from Bahamas by Doctorate Degree
In terms of doctorate degree, the demographic groups most similar to Immigrants from Bahamas are Chickasaw (1.5%, a difference of 0.17%), Blackfeet (1.5%, a difference of 0.18%), Immigrants from Portugal (1.5%, a difference of 0.32%), Nicaraguan (1.5%, a difference of 0.47%), and Japanese (1.5%, a difference of 0.79%).
| Demographics | Rating | Rank | Doctorate Degree |
| Central American Indians | 1.0 /100 | #256 | Tragic 1.5% |
| Chippewa | 0.9 /100 | #257 | Tragic 1.5% |
| Immigrants | West Indies | 0.9 /100 | #258 | Tragic 1.5% |
| Liberians | 0.9 /100 | #259 | Tragic 1.5% |
| Japanese | 0.9 /100 | #260 | Tragic 1.5% |
| Immigrants | Portugal | 0.8 /100 | #261 | Tragic 1.5% |
| Chickasaw | 0.7 /100 | #262 | Tragic 1.5% |
| Immigrants | Bahamas | 0.7 /100 | #263 | Tragic 1.5% |
| Blackfeet | 0.7 /100 | #264 | Tragic 1.5% |
| Nicaraguans | 0.6 /100 | #265 | Tragic 1.5% |
| Immigrants | Liberia | 0.5 /100 | #266 | Tragic 1.5% |
| Kiowa | 0.5 /100 | #267 | Tragic 1.5% |
| U.S. Virgin Islanders | 0.5 /100 | #268 | Tragic 1.5% |
| Crow | 0.5 /100 | #269 | Tragic 1.5% |
| Salvadorans | 0.5 /100 | #270 | Tragic 1.5% |
Demographics Similar to Immigrants from Ireland by Doctorate Degree
In terms of doctorate degree, the demographic groups most similar to Immigrants from Ireland are Estonian (2.5%, a difference of 0.41%), Russian (2.6%, a difference of 0.49%), Immigrants from Kuwait (2.6%, a difference of 0.65%), Immigrants from Russia (2.5%, a difference of 0.74%), and Immigrants from Spain (2.6%, a difference of 0.92%).
| Demographics | Rating | Rank | Doctorate Degree |
| Immigrants | Northern Europe | 100.0 /100 | #32 | Exceptional 2.6% |
| Cambodians | 100.0 /100 | #33 | Exceptional 2.6% |
| Cypriots | 100.0 /100 | #34 | Exceptional 2.6% |
| Immigrants | Malaysia | 100.0 /100 | #35 | Exceptional 2.6% |
| Immigrants | Spain | 100.0 /100 | #36 | Exceptional 2.6% |
| Immigrants | Kuwait | 100.0 /100 | #37 | Exceptional 2.6% |
| Russians | 100.0 /100 | #38 | Exceptional 2.6% |
| Immigrants | Ireland | 100.0 /100 | #39 | Exceptional 2.5% |
| Estonians | 100.0 /100 | #40 | Exceptional 2.5% |
| Immigrants | Russia | 100.0 /100 | #41 | Exceptional 2.5% |
| New Zealanders | 100.0 /100 | #42 | Exceptional 2.5% |
| Soviet Union | 100.0 /100 | #43 | Exceptional 2.5% |
| Immigrants | Netherlands | 100.0 /100 | #44 | Exceptional 2.5% |
| Immigrants | South Africa | 100.0 /100 | #45 | Exceptional 2.4% |
| Immigrants | Austria | 100.0 /100 | #46 | Exceptional 2.4% |