Immigrants from Bahamas vs Palestinian Householder Income Over 65 years
COMPARE
Immigrants from Bahamas
Palestinian
Householder Income Over 65 years
Householder Income Over 65 years Comparison
Immigrants from Bahamas
Palestinians
$53,174
HOUSEHOLDER INCOME OVER 65 YEARS
0.0/ 100
METRIC RATING
300th/ 347
METRIC RANK
$63,800
HOUSEHOLDER INCOME OVER 65 YEARS
95.1/ 100
METRIC RATING
108th/ 347
METRIC RANK
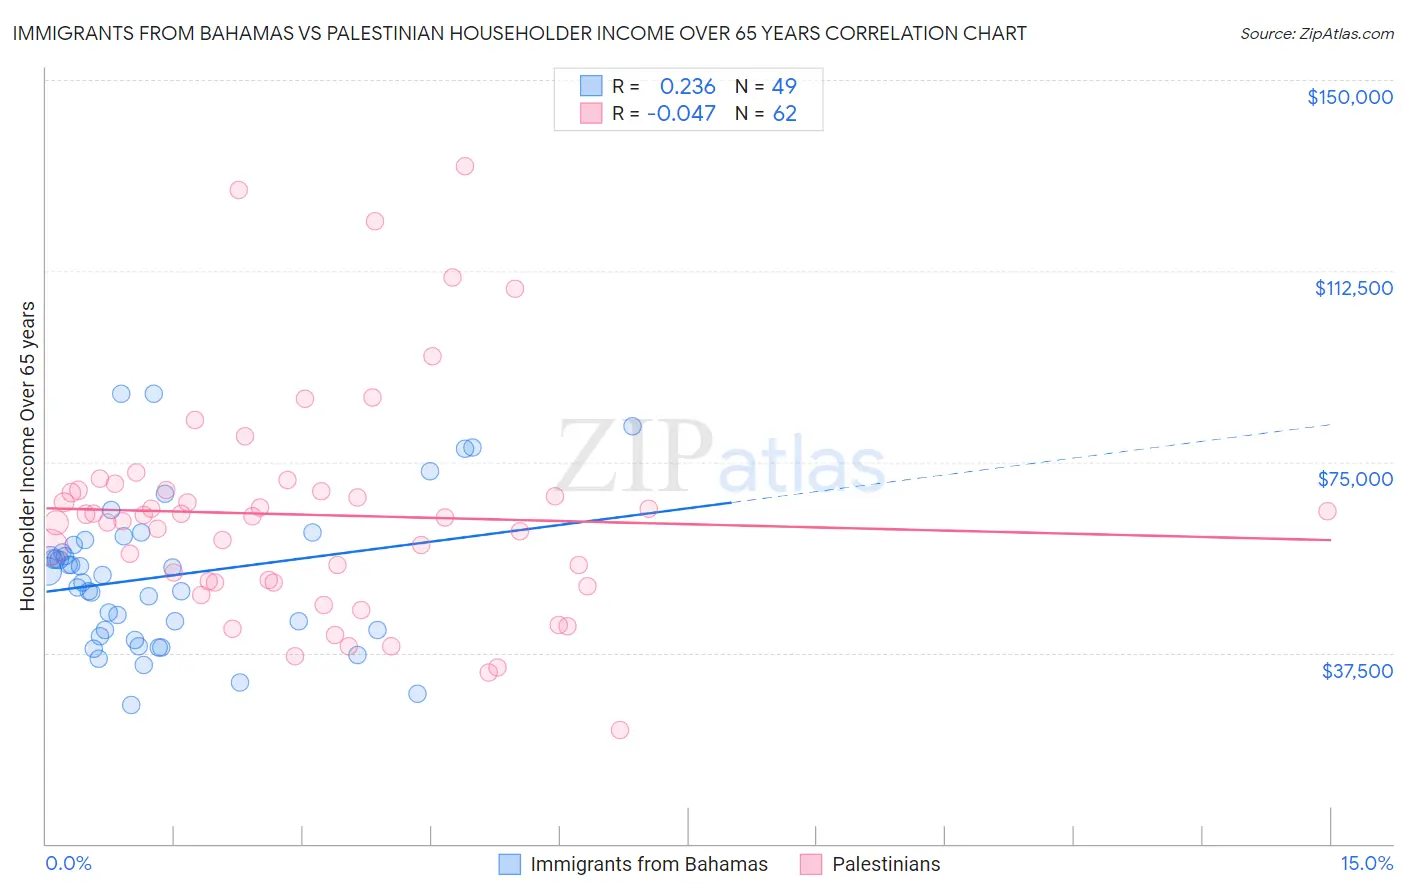
Immigrants from Bahamas vs Palestinian Householder Income Over 65 years Correlation Chart
The statistical analysis conducted on geographies consisting of 104,535,567 people shows a weak positive correlation between the proportion of Immigrants from Bahamas and household income with householder over the age of 65 in the United States with a correlation coefficient (R) of 0.236 and weighted average of $53,174. Similarly, the statistical analysis conducted on geographies consisting of 216,153,975 people shows no correlation between the proportion of Palestinians and household income with householder over the age of 65 in the United States with a correlation coefficient (R) of -0.047 and weighted average of $63,800, a difference of 20.0%.
Householder Income Over 65 years Correlation Summary
| Measurement | Immigrants from Bahamas | Palestinian |
| Minimum | $27,353 | $22,303 |
| Maximum | $88,339 | $133,182 |
| Range | $60,986 | $110,879 |
| Mean | $52,591 | $64,585 |
| Median | $52,760 | $64,219 |
| Interquartile 25% (IQ1) | $41,261 | $51,418 |
| Interquartile 75% (IQ3) | $59,091 | $69,430 |
| Interquartile Range (IQR) | $17,831 | $18,012 |
| Standard Deviation (Sample) | $14,436 | $21,891 |
| Standard Deviation (Population) | $14,288 | $21,714 |
Similar Demographics by Householder Income Over 65 years
Demographics Similar to Immigrants from Bahamas by Householder Income Over 65 years
In terms of householder income over 65 years, the demographic groups most similar to Immigrants from Bahamas are Ottawa ($53,217, a difference of 0.080%), Central American Indian ($53,232, a difference of 0.11%), Yuman ($53,110, a difference of 0.12%), Immigrants from Latin America ($53,265, a difference of 0.17%), and Spanish American Indian ($53,077, a difference of 0.18%).
| Demographics | Rating | Rank | Householder Income Over 65 years |
| Immigrants | Belize | 0.0 /100 | #293 | Tragic $53,665 |
| Senegalese | 0.0 /100 | #294 | Tragic $53,591 |
| Immigrants | Central America | 0.0 /100 | #295 | Tragic $53,420 |
| Immigrants | Somalia | 0.0 /100 | #296 | Tragic $53,333 |
| Immigrants | Latin America | 0.0 /100 | #297 | Tragic $53,265 |
| Central American Indians | 0.0 /100 | #298 | Tragic $53,232 |
| Ottawa | 0.0 /100 | #299 | Tragic $53,217 |
| Immigrants | Bahamas | 0.0 /100 | #300 | Tragic $53,174 |
| Yuman | 0.0 /100 | #301 | Tragic $53,110 |
| Spanish American Indians | 0.0 /100 | #302 | Tragic $53,077 |
| Choctaw | 0.0 /100 | #303 | Tragic $53,060 |
| Ute | 0.0 /100 | #304 | Tragic $52,949 |
| Pueblo | 0.0 /100 | #305 | Tragic $52,930 |
| Pennsylvania Germans | 0.0 /100 | #306 | Tragic $52,888 |
| Hispanics or Latinos | 0.0 /100 | #307 | Tragic $52,832 |
Demographics Similar to Palestinians by Householder Income Over 65 years
In terms of householder income over 65 years, the demographic groups most similar to Palestinians are European ($63,779, a difference of 0.030%), Pakistani ($63,844, a difference of 0.070%), Italian ($63,885, a difference of 0.13%), Immigrants from Argentina ($63,885, a difference of 0.13%), and Immigrants from Cameroon ($63,907, a difference of 0.17%).
| Demographics | Rating | Rank | Householder Income Over 65 years |
| Immigrants | Italy | 96.2 /100 | #101 | Exceptional $64,065 |
| Chileans | 95.8 /100 | #102 | Exceptional $63,957 |
| British | 95.7 /100 | #103 | Exceptional $63,940 |
| Immigrants | Cameroon | 95.6 /100 | #104 | Exceptional $63,907 |
| Italians | 95.5 /100 | #105 | Exceptional $63,885 |
| Immigrants | Argentina | 95.5 /100 | #106 | Exceptional $63,885 |
| Pakistanis | 95.3 /100 | #107 | Exceptional $63,844 |
| Palestinians | 95.1 /100 | #108 | Exceptional $63,800 |
| Europeans | 95.0 /100 | #109 | Exceptional $63,779 |
| Immigrants | Zimbabwe | 94.3 /100 | #110 | Exceptional $63,643 |
| Immigrants | Spain | 93.7 /100 | #111 | Exceptional $63,540 |
| Syrians | 93.4 /100 | #112 | Exceptional $63,494 |
| Immigrants | Serbia | 92.7 /100 | #113 | Exceptional $63,387 |
| Immigrants | Saudi Arabia | 92.4 /100 | #114 | Exceptional $63,355 |
| Croatians | 91.4 /100 | #115 | Exceptional $63,225 |