Immigrants from Bahamas vs Palestinian 12th Grade, No Diploma
COMPARE
Immigrants from Bahamas
Palestinian
12th Grade, No Diploma
12th Grade, No Diploma Comparison
Immigrants from Bahamas
Palestinians
90.2%
12TH GRADE, NO DIPLOMA
3.6/ 100
METRIC RATING
229th/ 347
METRIC RANK
92.1%
12TH GRADE, NO DIPLOMA
97.0/ 100
METRIC RATING
110th/ 347
METRIC RANK
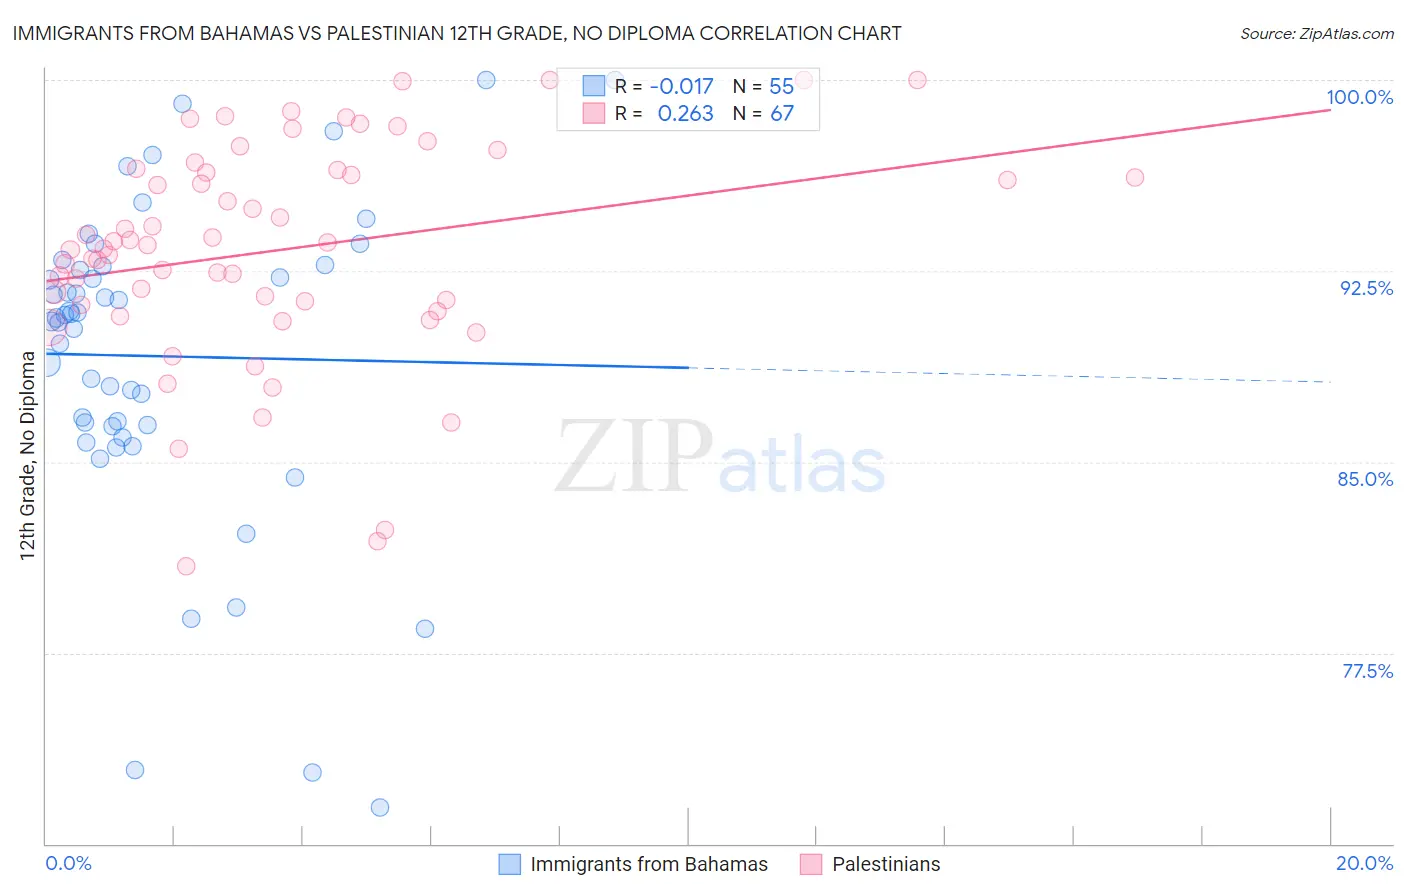
Immigrants from Bahamas vs Palestinian 12th Grade, No Diploma Correlation Chart
The statistical analysis conducted on geographies consisting of 104,668,341 people shows no correlation between the proportion of Immigrants from Bahamas and percentage of population with at least 12th grade (no diploma) education in the United States with a correlation coefficient (R) of -0.017 and weighted average of 90.2%. Similarly, the statistical analysis conducted on geographies consisting of 216,461,770 people shows a weak positive correlation between the proportion of Palestinians and percentage of population with at least 12th grade (no diploma) education in the United States with a correlation coefficient (R) of 0.263 and weighted average of 92.1%, a difference of 2.1%.
12th Grade, No Diploma Correlation Summary
| Measurement | Immigrants from Bahamas | Palestinian |
| Minimum | 71.4% | 80.9% |
| Maximum | 100.0% | 100.0% |
| Range | 28.6% | 19.1% |
| Mean | 89.2% | 93.3% |
| Median | 90.7% | 93.5% |
| Interquartile 25% (IQ1) | 86.4% | 91.2% |
| Interquartile 75% (IQ3) | 92.7% | 96.5% |
| Interquartile Range (IQR) | 6.3% | 5.3% |
| Standard Deviation (Sample) | 6.3% | 4.3% |
| Standard Deviation (Population) | 6.2% | 4.3% |
Similar Demographics by 12th Grade, No Diploma
Demographics Similar to Immigrants from Bahamas by 12th Grade, No Diploma
In terms of 12th grade, no diploma, the demographic groups most similar to Immigrants from Bahamas are Creek (90.3%, a difference of 0.020%), Nigerian (90.3%, a difference of 0.070%), Immigrants from Zaire (90.3%, a difference of 0.080%), Immigrants from Panama (90.3%, a difference of 0.090%), and Chickasaw (90.3%, a difference of 0.090%).
| Demographics | Rating | Rank | 12th Grade, No Diploma |
| Immigrants | Somalia | 5.3 /100 | #222 | Tragic 90.4% |
| South Americans | 5.0 /100 | #223 | Tragic 90.3% |
| Immigrants | Panama | 4.8 /100 | #224 | Tragic 90.3% |
| Chickasaw | 4.8 /100 | #225 | Tragic 90.3% |
| Immigrants | Zaire | 4.6 /100 | #226 | Tragic 90.3% |
| Nigerians | 4.5 /100 | #227 | Tragic 90.3% |
| Creek | 3.9 /100 | #228 | Tragic 90.3% |
| Immigrants | Bahamas | 3.6 /100 | #229 | Tragic 90.2% |
| Immigrants | Philippines | 2.8 /100 | #230 | Tragic 90.2% |
| Peruvians | 2.7 /100 | #231 | Tragic 90.2% |
| Blackfeet | 2.4 /100 | #232 | Tragic 90.1% |
| Immigrants | Thailand | 2.3 /100 | #233 | Tragic 90.1% |
| Immigrants | South America | 2.3 /100 | #234 | Tragic 90.1% |
| Colville | 2.3 /100 | #235 | Tragic 90.1% |
| Immigrants | Uzbekistan | 2.2 /100 | #236 | Tragic 90.1% |
Demographics Similar to Palestinians by 12th Grade, No Diploma
In terms of 12th grade, no diploma, the demographic groups most similar to Palestinians are Immigrants from Hungary (92.1%, a difference of 0.0%), Immigrants from Greece (92.1%, a difference of 0.010%), Jordanian (92.2%, a difference of 0.020%), Israeli (92.1%, a difference of 0.020%), and Syrian (92.2%, a difference of 0.030%).
| Demographics | Rating | Rank | 12th Grade, No Diploma |
| Immigrants | Norway | 98.1 /100 | #103 | Exceptional 92.3% |
| Lebanese | 97.6 /100 | #104 | Exceptional 92.2% |
| Immigrants | Belarus | 97.4 /100 | #105 | Exceptional 92.2% |
| Immigrants | Russia | 97.3 /100 | #106 | Exceptional 92.2% |
| Syrians | 97.2 /100 | #107 | Exceptional 92.2% |
| Jordanians | 97.2 /100 | #108 | Exceptional 92.2% |
| Immigrants | Hungary | 97.0 /100 | #109 | Exceptional 92.1% |
| Palestinians | 97.0 /100 | #110 | Exceptional 92.1% |
| Immigrants | Greece | 96.9 /100 | #111 | Exceptional 92.1% |
| Israelis | 96.8 /100 | #112 | Exceptional 92.1% |
| Immigrants | Zimbabwe | 96.5 /100 | #113 | Exceptional 92.1% |
| Yugoslavians | 96.5 /100 | #114 | Exceptional 92.1% |
| Immigrants | Sri Lanka | 96.4 /100 | #115 | Exceptional 92.1% |
| Aleuts | 96.3 /100 | #116 | Exceptional 92.1% |
| Immigrants | Eastern Europe | 96.3 /100 | #117 | Exceptional 92.1% |