Immigrants from Venezuela vs Immigrants from Cabo Verde College, 1 year or more
COMPARE
Immigrants from Venezuela
Immigrants from Cabo Verde
College, 1 year or more
College, 1 year or more Comparison
Immigrants from Venezuela
Immigrants from Cabo Verde
61.0%
COLLEGE, 1 YEAR OR MORE
87.9/ 100
METRIC RATING
134th/ 347
METRIC RANK
48.1%
COLLEGE, 1 YEAR OR MORE
0.0/ 100
METRIC RATING
340th/ 347
METRIC RANK
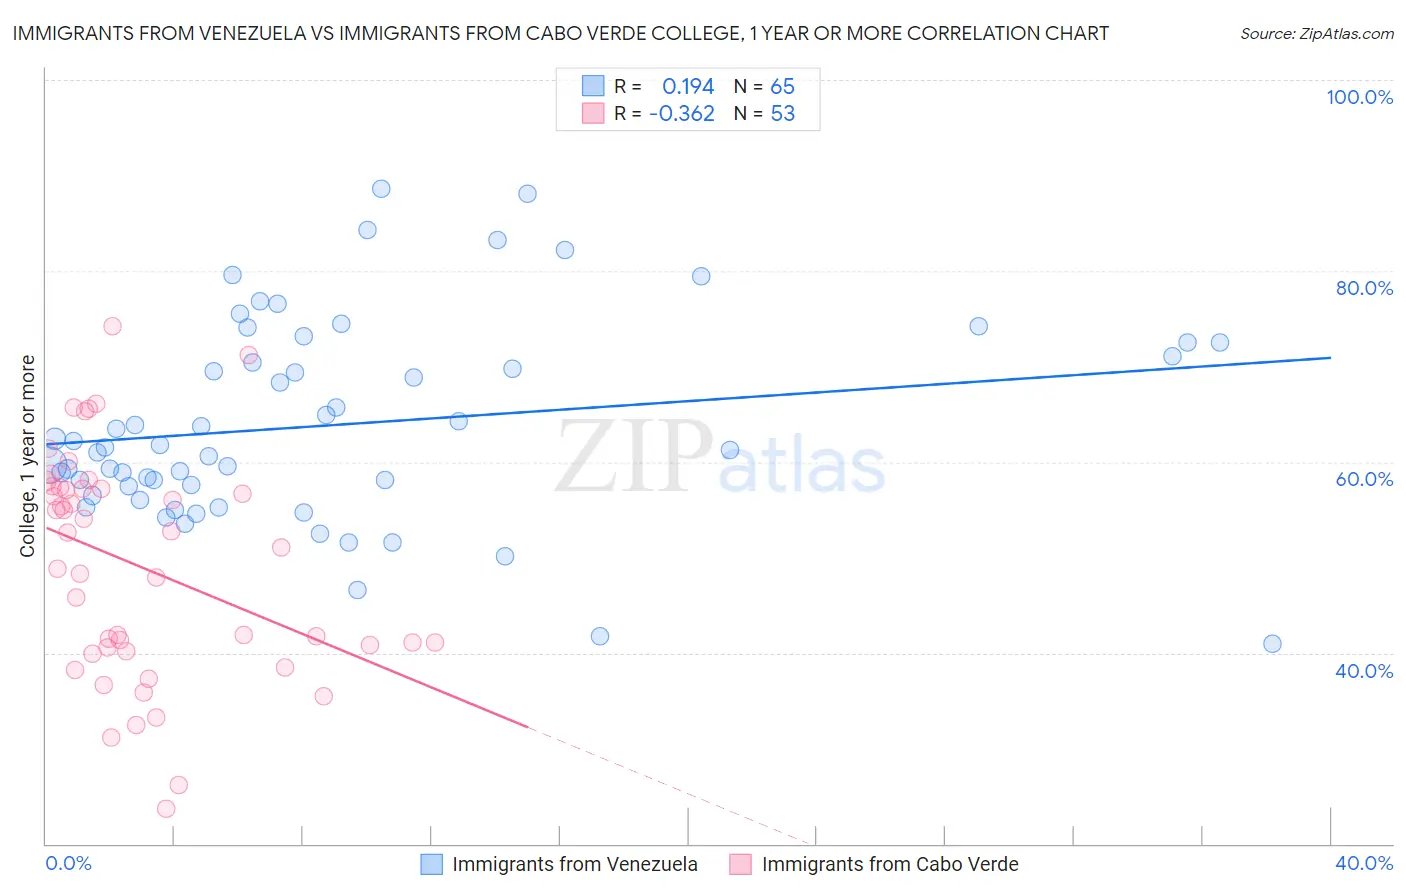
Immigrants from Venezuela vs Immigrants from Cabo Verde College, 1 year or more Correlation Chart
The statistical analysis conducted on geographies consisting of 287,865,065 people shows a poor positive correlation between the proportion of Immigrants from Venezuela and percentage of population with at least college, 1 year or more education in the United States with a correlation coefficient (R) of 0.194 and weighted average of 61.0%. Similarly, the statistical analysis conducted on geographies consisting of 38,158,666 people shows a mild negative correlation between the proportion of Immigrants from Cabo Verde and percentage of population with at least college, 1 year or more education in the United States with a correlation coefficient (R) of -0.362 and weighted average of 48.1%, a difference of 26.8%.
College, 1 year or more Correlation Summary
| Measurement | Immigrants from Venezuela | Immigrants from Cabo Verde |
| Minimum | 41.0% | 23.7% |
| Maximum | 88.6% | 74.3% |
| Range | 47.7% | 50.5% |
| Mean | 63.9% | 49.1% |
| Median | 61.5% | 51.0% |
| Interquartile 25% (IQ1) | 57.0% | 40.4% |
| Interquartile 75% (IQ3) | 71.8% | 57.2% |
| Interquartile Range (IQR) | 14.8% | 16.8% |
| Standard Deviation (Sample) | 10.6% | 11.7% |
| Standard Deviation (Population) | 10.5% | 11.6% |
Similar Demographics by College, 1 year or more
Demographics Similar to Immigrants from Venezuela by College, 1 year or more
In terms of college, 1 year or more, the demographic groups most similar to Immigrants from Venezuela are Immigrants from Uzbekistan (61.0%, a difference of 0.010%), Scandinavian (61.0%, a difference of 0.040%), Immigrants from Uganda (60.9%, a difference of 0.060%), Basque (60.9%, a difference of 0.080%), and Slovene (60.9%, a difference of 0.16%).
| Demographics | Rating | Rank | College, 1 year or more |
| Immigrants | Eastern Africa | 91.1 /100 | #127 | Exceptional 61.2% |
| Immigrants | Italy | 91.1 /100 | #128 | Exceptional 61.2% |
| Ugandans | 90.7 /100 | #129 | Exceptional 61.2% |
| Italians | 89.5 /100 | #130 | Excellent 61.1% |
| Immigrants | Morocco | 89.5 /100 | #131 | Excellent 61.1% |
| Scandinavians | 88.2 /100 | #132 | Excellent 61.0% |
| Immigrants | Uzbekistan | 88.0 /100 | #133 | Excellent 61.0% |
| Immigrants | Venezuela | 87.9 /100 | #134 | Excellent 61.0% |
| Immigrants | Uganda | 87.4 /100 | #135 | Excellent 60.9% |
| Basques | 87.2 /100 | #136 | Excellent 60.9% |
| Slovenes | 86.5 /100 | #137 | Excellent 60.9% |
| Taiwanese | 84.3 /100 | #138 | Excellent 60.7% |
| Immigrants | Eritrea | 84.3 /100 | #139 | Excellent 60.7% |
| Iraqis | 83.3 /100 | #140 | Excellent 60.7% |
| Immigrants | Afghanistan | 83.1 /100 | #141 | Excellent 60.7% |
Demographics Similar to Immigrants from Cabo Verde by College, 1 year or more
In terms of college, 1 year or more, the demographic groups most similar to Immigrants from Cabo Verde are Immigrants from the Azores (48.4%, a difference of 0.57%), Immigrants from Central America (48.5%, a difference of 0.83%), Pennsylvania German (48.5%, a difference of 0.88%), Spanish American Indian (48.5%, a difference of 0.89%), and Immigrants from Mexico (47.5%, a difference of 1.2%).
| Demographics | Rating | Rank | College, 1 year or more |
| Immigrants | Dominican Republic | 0.0 /100 | #333 | Tragic 49.1% |
| Lumbee | 0.0 /100 | #334 | Tragic 48.9% |
| Yuman | 0.0 /100 | #335 | Tragic 48.7% |
| Spanish American Indians | 0.0 /100 | #336 | Tragic 48.5% |
| Pennsylvania Germans | 0.0 /100 | #337 | Tragic 48.5% |
| Immigrants | Central America | 0.0 /100 | #338 | Tragic 48.5% |
| Immigrants | Azores | 0.0 /100 | #339 | Tragic 48.4% |
| Immigrants | Cabo Verde | 0.0 /100 | #340 | Tragic 48.1% |
| Immigrants | Mexico | 0.0 /100 | #341 | Tragic 47.5% |
| Inupiat | 0.0 /100 | #342 | Tragic 47.2% |
| Tohono O'odham | 0.0 /100 | #343 | Tragic 47.1% |
| Yakama | 0.0 /100 | #344 | Tragic 46.2% |
| Pima | 0.0 /100 | #345 | Tragic 45.6% |
| Houma | 0.0 /100 | #346 | Tragic 41.2% |
| Yup'ik | 0.0 /100 | #347 | Tragic 39.4% |