Cypriot vs Immigrants from Cabo Verde College, 1 year or more
COMPARE
Cypriot
Immigrants from Cabo Verde
College, 1 year or more
College, 1 year or more Comparison
Cypriots
Immigrants from Cabo Verde
67.0%
COLLEGE, 1 YEAR OR MORE
100.0/ 100
METRIC RATING
12th/ 347
METRIC RANK
48.1%
COLLEGE, 1 YEAR OR MORE
0.0/ 100
METRIC RATING
340th/ 347
METRIC RANK
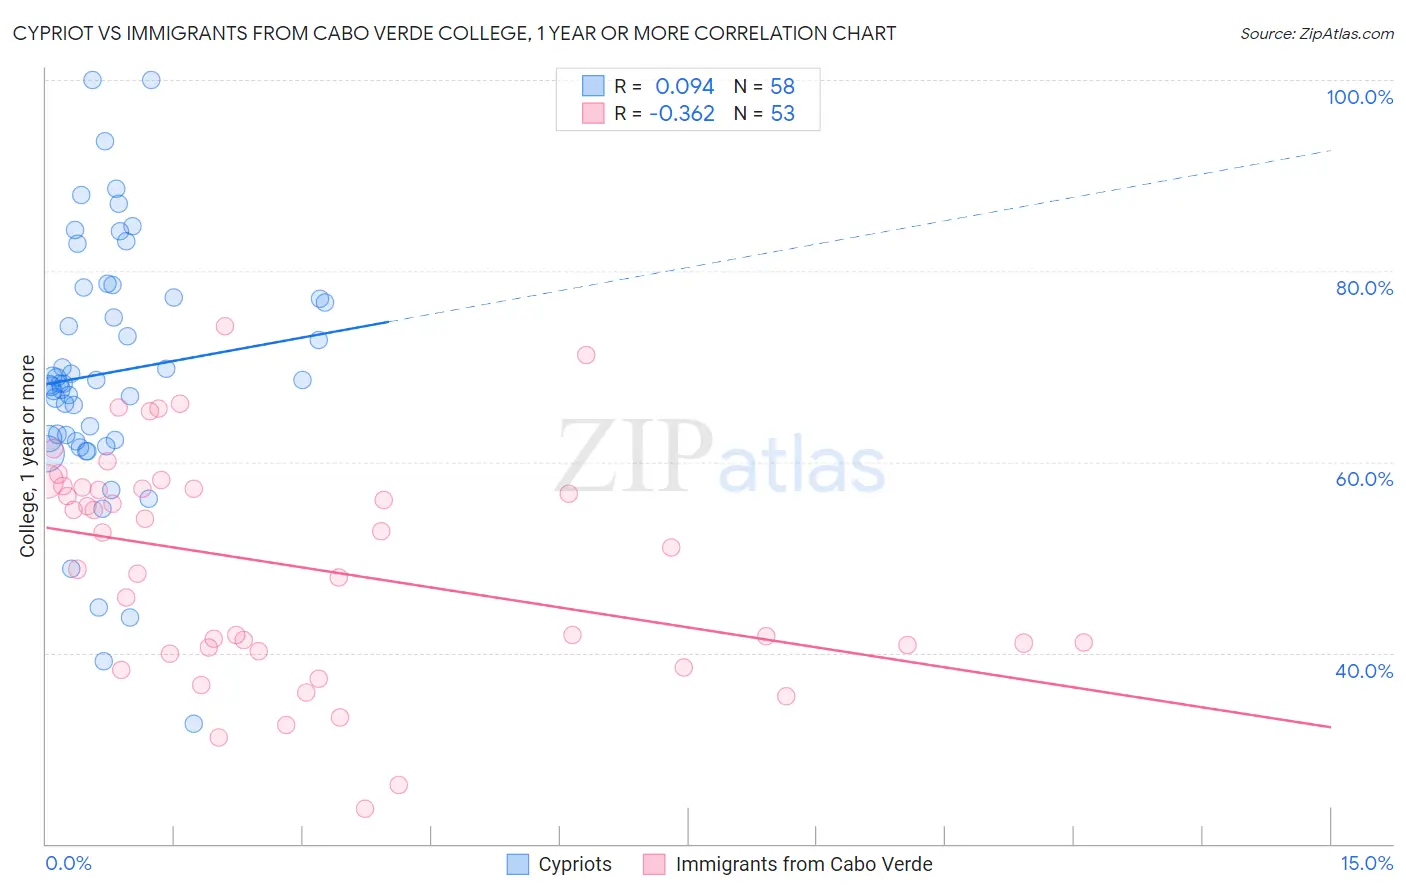
Cypriot vs Immigrants from Cabo Verde College, 1 year or more Correlation Chart
The statistical analysis conducted on geographies consisting of 61,870,752 people shows a slight positive correlation between the proportion of Cypriots and percentage of population with at least college, 1 year or more education in the United States with a correlation coefficient (R) of 0.094 and weighted average of 67.0%. Similarly, the statistical analysis conducted on geographies consisting of 38,158,666 people shows a mild negative correlation between the proportion of Immigrants from Cabo Verde and percentage of population with at least college, 1 year or more education in the United States with a correlation coefficient (R) of -0.362 and weighted average of 48.1%, a difference of 39.4%.
College, 1 year or more Correlation Summary
| Measurement | Cypriot | Immigrants from Cabo Verde |
| Minimum | 32.6% | 23.7% |
| Maximum | 100.0% | 74.3% |
| Range | 67.4% | 50.5% |
| Mean | 69.3% | 49.1% |
| Median | 68.2% | 51.0% |
| Interquartile 25% (IQ1) | 62.3% | 40.4% |
| Interquartile 75% (IQ3) | 77.2% | 57.2% |
| Interquartile Range (IQR) | 14.9% | 16.8% |
| Standard Deviation (Sample) | 13.4% | 11.7% |
| Standard Deviation (Population) | 13.3% | 11.6% |
Similar Demographics by College, 1 year or more
Demographics Similar to Cypriots by College, 1 year or more
In terms of college, 1 year or more, the demographic groups most similar to Cypriots are Immigrants from South Central Asia (67.1%, a difference of 0.17%), Immigrants from Sweden (66.8%, a difference of 0.31%), Burmese (66.7%, a difference of 0.50%), Cambodian (66.7%, a difference of 0.50%), and Immigrants from Japan (66.7%, a difference of 0.54%).
| Demographics | Rating | Rank | College, 1 year or more |
| Immigrants | India | 100.0 /100 | #5 | Exceptional 69.6% |
| Immigrants | Iran | 100.0 /100 | #6 | Exceptional 69.5% |
| Okinawans | 100.0 /100 | #7 | Exceptional 69.0% |
| Thais | 100.0 /100 | #8 | Exceptional 68.6% |
| Immigrants | Israel | 100.0 /100 | #9 | Exceptional 67.8% |
| Immigrants | Australia | 100.0 /100 | #10 | Exceptional 67.7% |
| Immigrants | South Central Asia | 100.0 /100 | #11 | Exceptional 67.1% |
| Cypriots | 100.0 /100 | #12 | Exceptional 67.0% |
| Immigrants | Sweden | 100.0 /100 | #13 | Exceptional 66.8% |
| Burmese | 100.0 /100 | #14 | Exceptional 66.7% |
| Cambodians | 100.0 /100 | #15 | Exceptional 66.7% |
| Immigrants | Japan | 100.0 /100 | #16 | Exceptional 66.7% |
| Immigrants | Eastern Asia | 100.0 /100 | #17 | Exceptional 66.6% |
| Eastern Europeans | 100.0 /100 | #18 | Exceptional 66.6% |
| Immigrants | Switzerland | 100.0 /100 | #19 | Exceptional 66.5% |
Demographics Similar to Immigrants from Cabo Verde by College, 1 year or more
In terms of college, 1 year or more, the demographic groups most similar to Immigrants from Cabo Verde are Immigrants from the Azores (48.4%, a difference of 0.57%), Immigrants from Central America (48.5%, a difference of 0.83%), Pennsylvania German (48.5%, a difference of 0.88%), Spanish American Indian (48.5%, a difference of 0.89%), and Immigrants from Mexico (47.5%, a difference of 1.2%).
| Demographics | Rating | Rank | College, 1 year or more |
| Immigrants | Dominican Republic | 0.0 /100 | #333 | Tragic 49.1% |
| Lumbee | 0.0 /100 | #334 | Tragic 48.9% |
| Yuman | 0.0 /100 | #335 | Tragic 48.7% |
| Spanish American Indians | 0.0 /100 | #336 | Tragic 48.5% |
| Pennsylvania Germans | 0.0 /100 | #337 | Tragic 48.5% |
| Immigrants | Central America | 0.0 /100 | #338 | Tragic 48.5% |
| Immigrants | Azores | 0.0 /100 | #339 | Tragic 48.4% |
| Immigrants | Cabo Verde | 0.0 /100 | #340 | Tragic 48.1% |
| Immigrants | Mexico | 0.0 /100 | #341 | Tragic 47.5% |
| Inupiat | 0.0 /100 | #342 | Tragic 47.2% |
| Tohono O'odham | 0.0 /100 | #343 | Tragic 47.1% |
| Yakama | 0.0 /100 | #344 | Tragic 46.2% |
| Pima | 0.0 /100 | #345 | Tragic 45.6% |
| Houma | 0.0 /100 | #346 | Tragic 41.2% |
| Yup'ik | 0.0 /100 | #347 | Tragic 39.4% |