Immigrants from Uruguay vs Immigrants from Cabo Verde College, 1 year or more
COMPARE
Immigrants from Uruguay
Immigrants from Cabo Verde
College, 1 year or more
College, 1 year or more Comparison
Immigrants from Uruguay
Immigrants from Cabo Verde
58.1%
COLLEGE, 1 YEAR OR MORE
15.2/ 100
METRIC RATING
208th/ 347
METRIC RANK
48.1%
COLLEGE, 1 YEAR OR MORE
0.0/ 100
METRIC RATING
340th/ 347
METRIC RANK
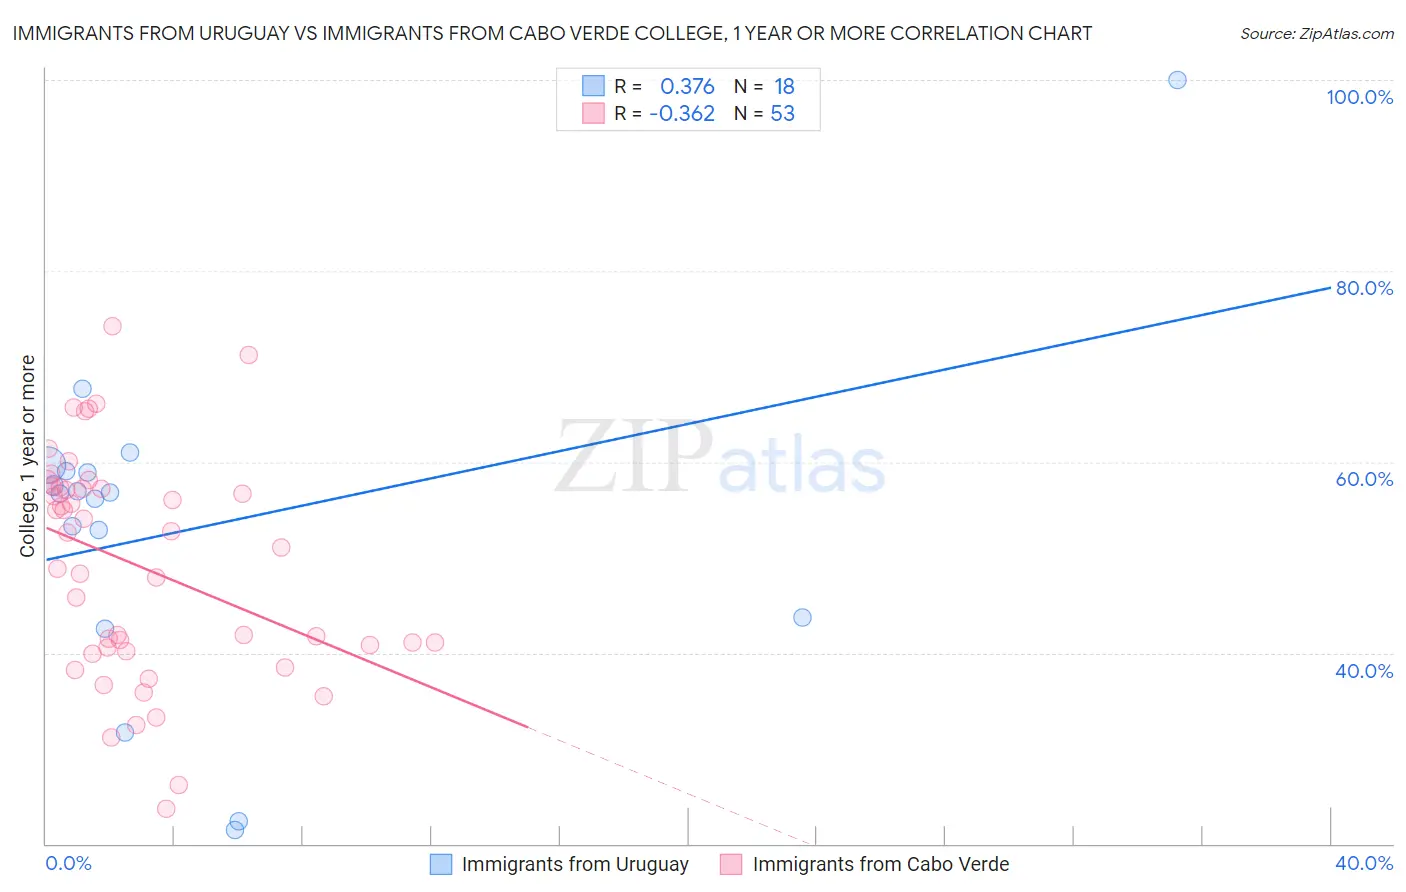
Immigrants from Uruguay vs Immigrants from Cabo Verde College, 1 year or more Correlation Chart
The statistical analysis conducted on geographies consisting of 133,259,667 people shows a mild positive correlation between the proportion of Immigrants from Uruguay and percentage of population with at least college, 1 year or more education in the United States with a correlation coefficient (R) of 0.376 and weighted average of 58.1%. Similarly, the statistical analysis conducted on geographies consisting of 38,158,666 people shows a mild negative correlation between the proportion of Immigrants from Cabo Verde and percentage of population with at least college, 1 year or more education in the United States with a correlation coefficient (R) of -0.362 and weighted average of 48.1%, a difference of 20.7%.
College, 1 year or more Correlation Summary
| Measurement | Immigrants from Uruguay | Immigrants from Cabo Verde |
| Minimum | 21.5% | 23.7% |
| Maximum | 100.0% | 74.3% |
| Range | 78.5% | 50.5% |
| Mean | 53.2% | 49.1% |
| Median | 56.7% | 51.0% |
| Interquartile 25% (IQ1) | 43.8% | 40.4% |
| Interquartile 75% (IQ3) | 59.1% | 57.2% |
| Interquartile Range (IQR) | 15.3% | 16.8% |
| Standard Deviation (Sample) | 17.6% | 11.7% |
| Standard Deviation (Population) | 17.1% | 11.6% |
Similar Demographics by College, 1 year or more
Demographics Similar to Immigrants from Uruguay by College, 1 year or more
In terms of college, 1 year or more, the demographic groups most similar to Immigrants from Uruguay are Immigrants from Middle Africa (58.0%, a difference of 0.13%), Senegalese (58.2%, a difference of 0.17%), Tsimshian (57.9%, a difference of 0.19%), Immigrants from Nigeria (57.9%, a difference of 0.22%), and Immigrants from Vietnam (58.2%, a difference of 0.29%).
| Demographics | Rating | Rank | College, 1 year or more |
| Nigerians | 23.0 /100 | #201 | Fair 58.5% |
| Immigrants | South America | 21.9 /100 | #202 | Fair 58.4% |
| Ghanaians | 20.9 /100 | #203 | Fair 58.4% |
| Panamanians | 19.2 /100 | #204 | Poor 58.3% |
| Immigrants | Zaire | 18.7 /100 | #205 | Poor 58.3% |
| Immigrants | Vietnam | 18.2 /100 | #206 | Poor 58.2% |
| Senegalese | 16.9 /100 | #207 | Poor 58.2% |
| Immigrants | Uruguay | 15.2 /100 | #208 | Poor 58.1% |
| Immigrants | Middle Africa | 14.0 /100 | #209 | Poor 58.0% |
| Tsimshian | 13.5 /100 | #210 | Poor 57.9% |
| Immigrants | Nigeria | 13.3 /100 | #211 | Poor 57.9% |
| Immigrants | Senegal | 11.8 /100 | #212 | Poor 57.8% |
| French Canadians | 11.8 /100 | #213 | Poor 57.8% |
| Immigrants | Colombia | 11.6 /100 | #214 | Poor 57.8% |
| Tongans | 11.6 /100 | #215 | Poor 57.8% |
Demographics Similar to Immigrants from Cabo Verde by College, 1 year or more
In terms of college, 1 year or more, the demographic groups most similar to Immigrants from Cabo Verde are Immigrants from the Azores (48.4%, a difference of 0.57%), Immigrants from Central America (48.5%, a difference of 0.83%), Pennsylvania German (48.5%, a difference of 0.88%), Spanish American Indian (48.5%, a difference of 0.89%), and Immigrants from Mexico (47.5%, a difference of 1.2%).
| Demographics | Rating | Rank | College, 1 year or more |
| Immigrants | Dominican Republic | 0.0 /100 | #333 | Tragic 49.1% |
| Lumbee | 0.0 /100 | #334 | Tragic 48.9% |
| Yuman | 0.0 /100 | #335 | Tragic 48.7% |
| Spanish American Indians | 0.0 /100 | #336 | Tragic 48.5% |
| Pennsylvania Germans | 0.0 /100 | #337 | Tragic 48.5% |
| Immigrants | Central America | 0.0 /100 | #338 | Tragic 48.5% |
| Immigrants | Azores | 0.0 /100 | #339 | Tragic 48.4% |
| Immigrants | Cabo Verde | 0.0 /100 | #340 | Tragic 48.1% |
| Immigrants | Mexico | 0.0 /100 | #341 | Tragic 47.5% |
| Inupiat | 0.0 /100 | #342 | Tragic 47.2% |
| Tohono O'odham | 0.0 /100 | #343 | Tragic 47.1% |
| Yakama | 0.0 /100 | #344 | Tragic 46.2% |
| Pima | 0.0 /100 | #345 | Tragic 45.6% |
| Houma | 0.0 /100 | #346 | Tragic 41.2% |
| Yup'ik | 0.0 /100 | #347 | Tragic 39.4% |