Immigrants from Bahamas vs Bulgarian Bachelor's Degree
COMPARE
Immigrants from Bahamas
Bulgarian
Bachelor's Degree
Bachelor's Degree Comparison
Immigrants from Bahamas
Bulgarians
33.3%
BACHELOR'S DEGREE
0.7/ 100
METRIC RATING
252nd/ 347
METRIC RANK
45.3%
BACHELOR'S DEGREE
100.0/ 100
METRIC RATING
38th/ 347
METRIC RANK
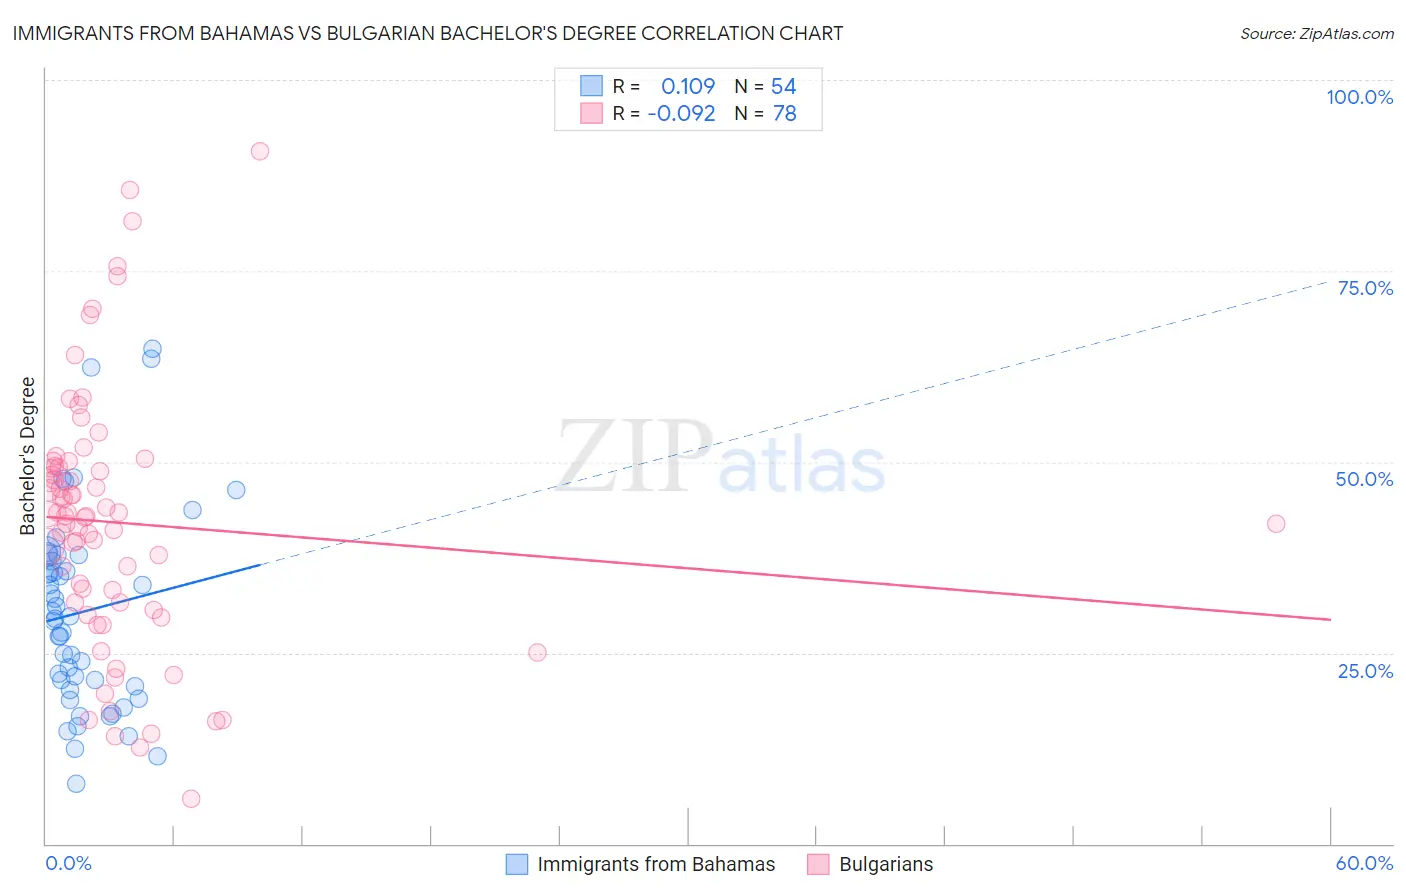
Immigrants from Bahamas vs Bulgarian Bachelor's Degree Correlation Chart
The statistical analysis conducted on geographies consisting of 104,662,355 people shows a poor positive correlation between the proportion of Immigrants from Bahamas and percentage of population with at least bachelor's degree education in the United States with a correlation coefficient (R) of 0.109 and weighted average of 33.3%. Similarly, the statistical analysis conducted on geographies consisting of 205,616,676 people shows a slight negative correlation between the proportion of Bulgarians and percentage of population with at least bachelor's degree education in the United States with a correlation coefficient (R) of -0.092 and weighted average of 45.3%, a difference of 36.0%.
Bachelor's Degree Correlation Summary
| Measurement | Immigrants from Bahamas | Bulgarian |
| Minimum | 7.9% | 5.9% |
| Maximum | 64.8% | 90.7% |
| Range | 56.9% | 84.8% |
| Mean | 30.4% | 42.0% |
| Median | 29.6% | 42.9% |
| Interquartile 25% (IQ1) | 20.7% | 31.5% |
| Interquartile 75% (IQ3) | 37.8% | 49.3% |
| Interquartile Range (IQR) | 17.1% | 17.7% |
| Standard Deviation (Sample) | 12.9% | 16.8% |
| Standard Deviation (Population) | 12.8% | 16.7% |
Similar Demographics by Bachelor's Degree
Demographics Similar to Immigrants from Bahamas by Bachelor's Degree
In terms of bachelor's degree, the demographic groups most similar to Immigrants from Bahamas are Japanese (33.3%, a difference of 0.070%), U.S. Virgin Islander (33.2%, a difference of 0.21%), Native Hawaiian (33.2%, a difference of 0.27%), Iroquois (33.2%, a difference of 0.28%), and Nicaraguan (33.1%, a difference of 0.47%).
| Demographics | Rating | Rank | Bachelor's Degree |
| Immigrants | Fiji | 1.2 /100 | #245 | Tragic 33.7% |
| Jamaicans | 1.0 /100 | #246 | Tragic 33.6% |
| Immigrants | Congo | 1.0 /100 | #247 | Tragic 33.6% |
| Cree | 1.0 /100 | #248 | Tragic 33.6% |
| Immigrants | Liberia | 0.9 /100 | #249 | Tragic 33.5% |
| Indonesians | 0.9 /100 | #250 | Tragic 33.5% |
| Japanese | 0.7 /100 | #251 | Tragic 33.3% |
| Immigrants | Bahamas | 0.7 /100 | #252 | Tragic 33.3% |
| U.S. Virgin Islanders | 0.7 /100 | #253 | Tragic 33.2% |
| Native Hawaiians | 0.7 /100 | #254 | Tragic 33.2% |
| Iroquois | 0.7 /100 | #255 | Tragic 33.2% |
| Nicaraguans | 0.6 /100 | #256 | Tragic 33.1% |
| Spanish Americans | 0.6 /100 | #257 | Tragic 33.1% |
| French American Indians | 0.6 /100 | #258 | Tragic 33.1% |
| Osage | 0.5 /100 | #259 | Tragic 33.0% |
Demographics Similar to Bulgarians by Bachelor's Degree
In terms of bachelor's degree, the demographic groups most similar to Bulgarians are Russian (45.3%, a difference of 0.090%), Mongolian (45.4%, a difference of 0.24%), Immigrants from Russia (45.4%, a difference of 0.26%), Immigrants from Denmark (45.4%, a difference of 0.28%), and Immigrants from Latvia (45.1%, a difference of 0.33%).
| Demographics | Rating | Rank | Bachelor's Degree |
| Latvians | 100.0 /100 | #31 | Exceptional 46.1% |
| Immigrants | Turkey | 100.0 /100 | #32 | Exceptional 46.0% |
| Immigrants | Northern Europe | 100.0 /100 | #33 | Exceptional 45.6% |
| Immigrants | Denmark | 100.0 /100 | #34 | Exceptional 45.4% |
| Immigrants | Russia | 100.0 /100 | #35 | Exceptional 45.4% |
| Mongolians | 100.0 /100 | #36 | Exceptional 45.4% |
| Russians | 100.0 /100 | #37 | Exceptional 45.3% |
| Bulgarians | 100.0 /100 | #38 | Exceptional 45.3% |
| Immigrants | Latvia | 100.0 /100 | #39 | Exceptional 45.1% |
| Immigrants | Belarus | 100.0 /100 | #40 | Exceptional 45.0% |
| Immigrants | Malaysia | 100.0 /100 | #41 | Exceptional 45.0% |
| Immigrants | Saudi Arabia | 100.0 /100 | #42 | Exceptional 44.8% |
| Immigrants | South Africa | 99.9 /100 | #43 | Exceptional 44.8% |
| Immigrants | Lithuania | 99.9 /100 | #44 | Exceptional 44.6% |
| Immigrants | Kuwait | 99.9 /100 | #45 | Exceptional 44.6% |