Immigrants from Austria vs Native Hawaiian GED/Equivalency
COMPARE
Immigrants from Austria
Native Hawaiian
GED/Equivalency
GED/Equivalency Comparison
Immigrants from Austria
Native Hawaiians
88.3%
GED/EQUIVALENCY
99.7/ 100
METRIC RATING
37th/ 347
METRIC RANK
87.5%
GED/EQUIVALENCY
98.1/ 100
METRIC RATING
87th/ 347
METRIC RANK
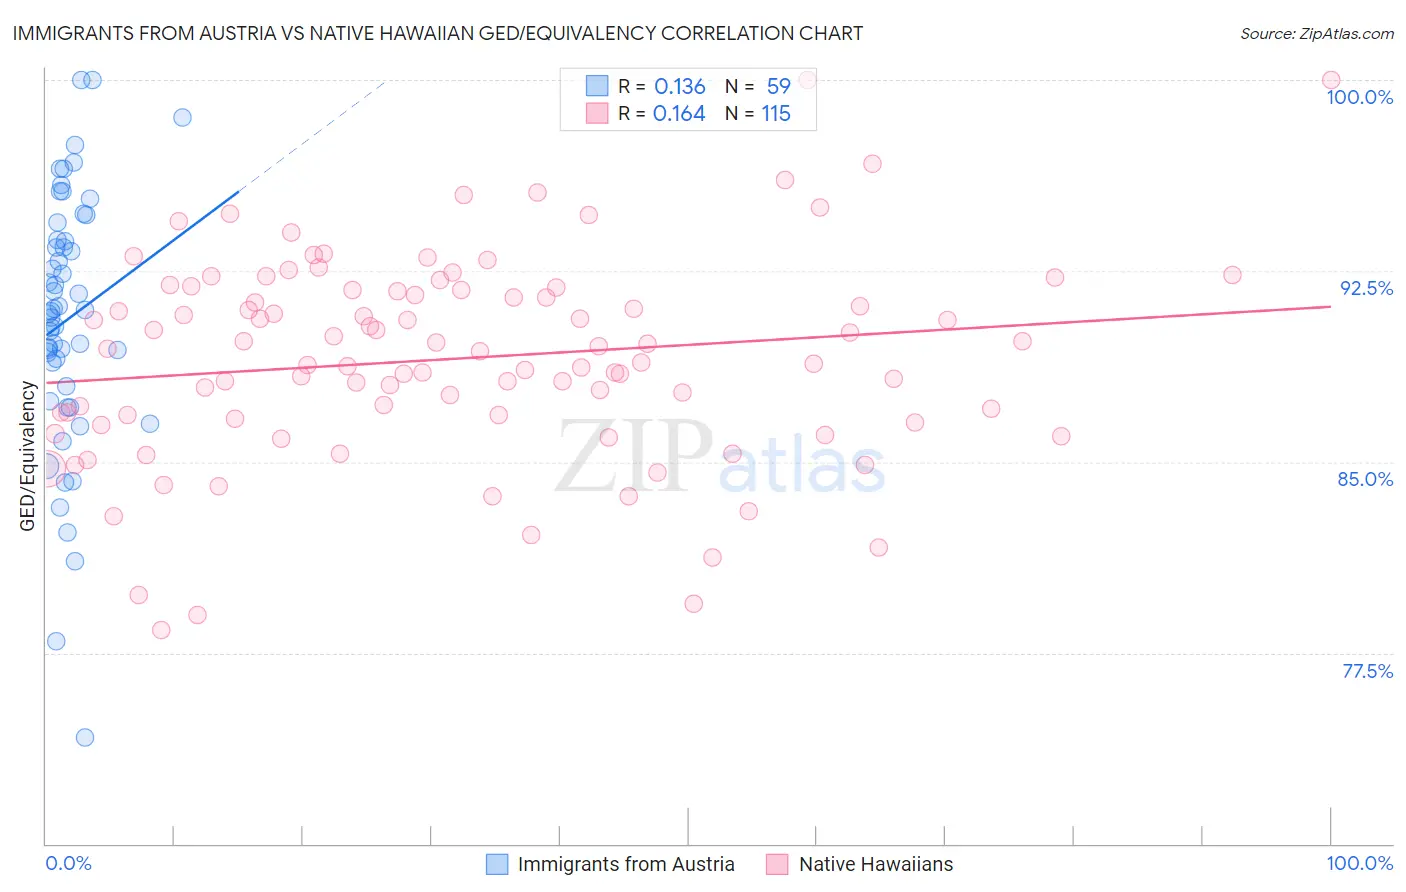
Immigrants from Austria vs Native Hawaiian GED/Equivalency Correlation Chart
The statistical analysis conducted on geographies consisting of 167,973,751 people shows a poor positive correlation between the proportion of Immigrants from Austria and percentage of population with at least ged/equivalency education in the United States with a correlation coefficient (R) of 0.136 and weighted average of 88.3%. Similarly, the statistical analysis conducted on geographies consisting of 332,118,930 people shows a poor positive correlation between the proportion of Native Hawaiians and percentage of population with at least ged/equivalency education in the United States with a correlation coefficient (R) of 0.164 and weighted average of 87.5%, a difference of 0.95%.
GED/Equivalency Correlation Summary
| Measurement | Immigrants from Austria | Native Hawaiian |
| Minimum | 74.2% | 78.4% |
| Maximum | 100.0% | 100.0% |
| Range | 25.8% | 21.6% |
| Mean | 90.6% | 89.1% |
| Median | 90.9% | 89.3% |
| Interquartile 25% (IQ1) | 88.0% | 86.7% |
| Interquartile 75% (IQ3) | 93.7% | 91.8% |
| Interquartile Range (IQR) | 5.7% | 5.1% |
| Standard Deviation (Sample) | 5.0% | 4.0% |
| Standard Deviation (Population) | 5.0% | 4.0% |
Similar Demographics by GED/Equivalency
Demographics Similar to Immigrants from Austria by GED/Equivalency
In terms of ged/equivalency, the demographic groups most similar to Immigrants from Austria are Immigrants from Belgium (88.3%, a difference of 0.030%), Burmese (88.3%, a difference of 0.030%), Immigrants from South Central Asia (88.4%, a difference of 0.050%), Immigrants from Japan (88.4%, a difference of 0.070%), and Immigrants from Sweden (88.4%, a difference of 0.080%).
| Demographics | Rating | Rank | GED/Equivalency |
| Turks | 99.8 /100 | #30 | Exceptional 88.5% |
| Bhutanese | 99.8 /100 | #31 | Exceptional 88.4% |
| Danes | 99.8 /100 | #32 | Exceptional 88.4% |
| Immigrants | Sweden | 99.7 /100 | #33 | Exceptional 88.4% |
| Immigrants | Japan | 99.7 /100 | #34 | Exceptional 88.4% |
| Immigrants | South Central Asia | 99.7 /100 | #35 | Exceptional 88.4% |
| Immigrants | Belgium | 99.7 /100 | #36 | Exceptional 88.3% |
| Immigrants | Austria | 99.7 /100 | #37 | Exceptional 88.3% |
| Burmese | 99.7 /100 | #38 | Exceptional 88.3% |
| Immigrants | Israel | 99.6 /100 | #39 | Exceptional 88.2% |
| Italians | 99.6 /100 | #40 | Exceptional 88.2% |
| Finns | 99.6 /100 | #41 | Exceptional 88.2% |
| Cambodians | 99.6 /100 | #42 | Exceptional 88.2% |
| Immigrants | Scotland | 99.6 /100 | #43 | Exceptional 88.2% |
| Macedonians | 99.5 /100 | #44 | Exceptional 88.1% |
Demographics Similar to Native Hawaiians by GED/Equivalency
In terms of ged/equivalency, the demographic groups most similar to Native Hawaiians are Immigrants from Europe (87.5%, a difference of 0.0%), Immigrants from Romania (87.5%, a difference of 0.010%), Dutch (87.5%, a difference of 0.010%), Immigrants from Norway (87.5%, a difference of 0.010%), and Hungarian (87.4%, a difference of 0.050%).
| Demographics | Rating | Rank | GED/Equivalency |
| Immigrants | England | 98.5 /100 | #80 | Exceptional 87.6% |
| Immigrants | Sri Lanka | 98.3 /100 | #81 | Exceptional 87.5% |
| Romanians | 98.3 /100 | #82 | Exceptional 87.5% |
| South Africans | 98.3 /100 | #83 | Exceptional 87.5% |
| Immigrants | Romania | 98.1 /100 | #84 | Exceptional 87.5% |
| Dutch | 98.1 /100 | #85 | Exceptional 87.5% |
| Immigrants | Europe | 98.1 /100 | #86 | Exceptional 87.5% |
| Native Hawaiians | 98.1 /100 | #87 | Exceptional 87.5% |
| Immigrants | Norway | 98.1 /100 | #88 | Exceptional 87.5% |
| Hungarians | 97.9 /100 | #89 | Exceptional 87.4% |
| Welsh | 97.9 /100 | #90 | Exceptional 87.4% |
| Immigrants | Eastern Asia | 97.9 /100 | #91 | Exceptional 87.4% |
| Israelis | 97.8 /100 | #92 | Exceptional 87.4% |
| Immigrants | North Macedonia | 97.8 /100 | #93 | Exceptional 87.4% |
| Immigrants | Russia | 97.8 /100 | #94 | Exceptional 87.4% |