Immigrants from Afghanistan vs Latvian Unemployment
COMPARE
Immigrants from Afghanistan
Latvian
Unemployment
Unemployment Comparison
Immigrants from Afghanistan
Latvians
5.3%
UNEMPLOYMENT
28.6/ 100
METRIC RATING
199th/ 347
METRIC RANK
4.7%
UNEMPLOYMENT
99.9/ 100
METRIC RATING
25th/ 347
METRIC RANK
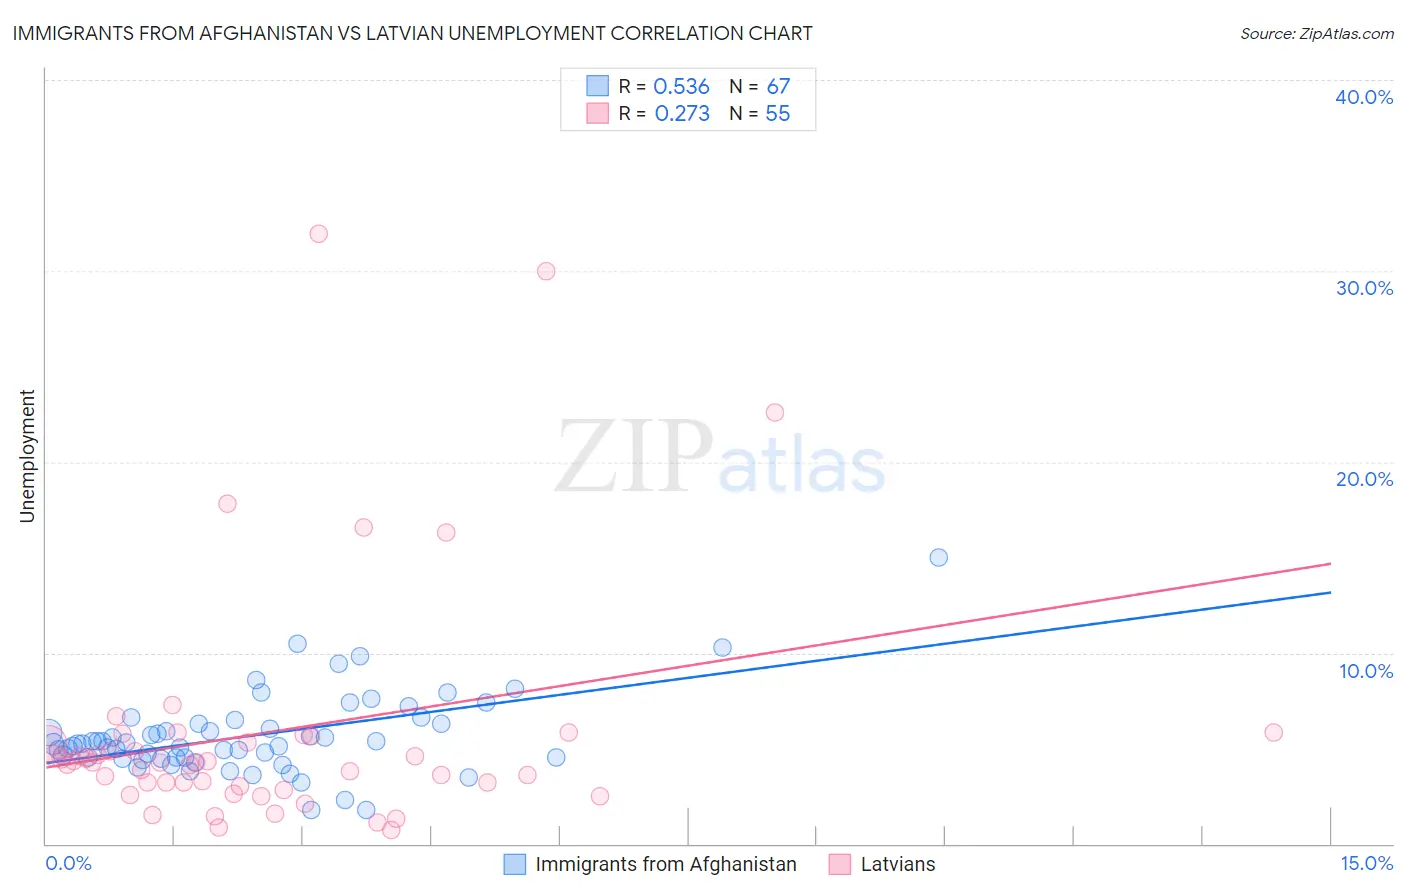
Immigrants from Afghanistan vs Latvian Unemployment Correlation Chart
The statistical analysis conducted on geographies consisting of 147,628,423 people shows a substantial positive correlation between the proportion of Immigrants from Afghanistan and unemployment in the United States with a correlation coefficient (R) of 0.536 and weighted average of 5.3%. Similarly, the statistical analysis conducted on geographies consisting of 220,638,236 people shows a weak positive correlation between the proportion of Latvians and unemployment in the United States with a correlation coefficient (R) of 0.273 and weighted average of 4.7%, a difference of 13.2%.
Unemployment Correlation Summary
| Measurement | Immigrants from Afghanistan | Latvian |
| Minimum | 1.8% | 0.70% |
| Maximum | 15.0% | 32.0% |
| Range | 13.2% | 31.3% |
| Mean | 5.6% | 5.9% |
| Median | 5.2% | 4.3% |
| Interquartile 25% (IQ1) | 4.5% | 3.0% |
| Interquartile 75% (IQ3) | 6.3% | 5.6% |
| Interquartile Range (IQR) | 1.8% | 2.6% |
| Standard Deviation (Sample) | 2.1% | 6.4% |
| Standard Deviation (Population) | 2.1% | 6.4% |
Similar Demographics by Unemployment
Demographics Similar to Immigrants from Afghanistan by Unemployment
In terms of unemployment, the demographic groups most similar to Immigrants from Afghanistan are Immigrants from Israel (5.3%, a difference of 0.0%), Immigrants from Uruguay (5.3%, a difference of 0.090%), Korean (5.3%, a difference of 0.090%), Peruvian (5.3%, a difference of 0.10%), and Immigrants from South Eastern Asia (5.3%, a difference of 0.12%).
| Demographics | Rating | Rank | Unemployment |
| South Americans | 33.9 /100 | #192 | Fair 5.3% |
| Immigrants | Somalia | 33.8 /100 | #193 | Fair 5.3% |
| Immigrants | Laos | 30.9 /100 | #194 | Fair 5.3% |
| Immigrants | Southern Europe | 30.9 /100 | #195 | Fair 5.3% |
| Peruvians | 29.9 /100 | #196 | Fair 5.3% |
| Immigrants | Uruguay | 29.8 /100 | #197 | Fair 5.3% |
| Immigrants | Israel | 28.6 /100 | #198 | Fair 5.3% |
| Immigrants | Afghanistan | 28.6 /100 | #199 | Fair 5.3% |
| Koreans | 27.4 /100 | #200 | Fair 5.3% |
| Immigrants | South Eastern Asia | 27.0 /100 | #201 | Fair 5.3% |
| Cherokee | 25.5 /100 | #202 | Fair 5.3% |
| Immigrants | Micronesia | 25.2 /100 | #203 | Fair 5.3% |
| Immigrants | Ukraine | 24.9 /100 | #204 | Fair 5.3% |
| Native Hawaiians | 24.1 /100 | #205 | Fair 5.3% |
| Immigrants | Peru | 22.7 /100 | #206 | Fair 5.4% |
Demographics Similar to Latvians by Unemployment
In terms of unemployment, the demographic groups most similar to Latvians are Bulgarian (4.7%, a difference of 0.040%), Venezuelan (4.7%, a difference of 0.070%), British (4.7%, a difference of 0.15%), Finnish (4.7%, a difference of 0.25%), and Welsh (4.7%, a difference of 0.45%).
| Demographics | Rating | Rank | Unemployment |
| Immigrants | Venezuela | 99.9 /100 | #18 | Exceptional 4.7% |
| Scottish | 99.9 /100 | #19 | Exceptional 4.7% |
| Carpatho Rusyns | 99.9 /100 | #20 | Exceptional 4.7% |
| Welsh | 99.9 /100 | #21 | Exceptional 4.7% |
| Thais | 99.9 /100 | #22 | Exceptional 4.7% |
| British | 99.9 /100 | #23 | Exceptional 4.7% |
| Venezuelans | 99.9 /100 | #24 | Exceptional 4.7% |
| Latvians | 99.9 /100 | #25 | Exceptional 4.7% |
| Bulgarians | 99.9 /100 | #26 | Exceptional 4.7% |
| Finns | 99.9 /100 | #27 | Exceptional 4.7% |
| Cubans | 99.8 /100 | #28 | Exceptional 4.7% |
| Poles | 99.8 /100 | #29 | Exceptional 4.7% |
| Irish | 99.8 /100 | #30 | Exceptional 4.8% |
| Croatians | 99.8 /100 | #31 | Exceptional 4.8% |
| Zimbabweans | 99.8 /100 | #32 | Exceptional 4.8% |